Upload date
All time
Last hour
Today
This week
This month
This year
Type
All
Video
Channel
Playlist
Movie
Duration
Short (< 4 minutes)
Medium (4-20 minutes)
Long (> 20 minutes)
Sort by
Relevance
Rating
View count
Features
HD
Subtitles/CC
Creative Commons
3D
Live
4K
360°
VR180
HDR
8,688 results
This video today is a crash course on Seaborn, a data visualization library for Python built on top of Matplotlib. It makes it super ...
7,245 views
1 month ago
This Seaborn Full Course by Intellipaat is your one-stop guide to mastering data visualization in Python using Seaborn. Perfect for ...
50,850 views
7 months ago
Curso Estadística Descriptiva: https://codificandobits.com/curso/estadistica-descriptiva/ Asesorías y formación ...
2,657 views
6 months ago
If you work with data in Python, at some point you'll need to visualize it. In this video, I'll show you the differences ...
1,772 views
10 months ago
Learn how to analyze and visualize data like a real data analyst using Seaborn! In this step-by-step Seaborn tutorial, I'll show you ...
619 views
3 months ago
Watch more videos in our playlist: https://www.youtube.com/playlist?list=PLrnff5h2gC2I40C6-oawAWmFcyB2D33wi Python ...
12,022 views
Streamed 5 months ago
Welcome to the Complete Data Visualization in Python Course! In this full video tutorial, we're diving deep into the world of ...
101,286 views
9 months ago
In my last video, I showed how elegant and simple plotnine makes the Grammar of Graphics in Python. This time, I put Seaborn's ...
412 views
5 months ago
This is the only Python data visualisation tutorial you need to learn for a career in Data Science, AI, and Machine Learning in 2025 ...
55,452 views
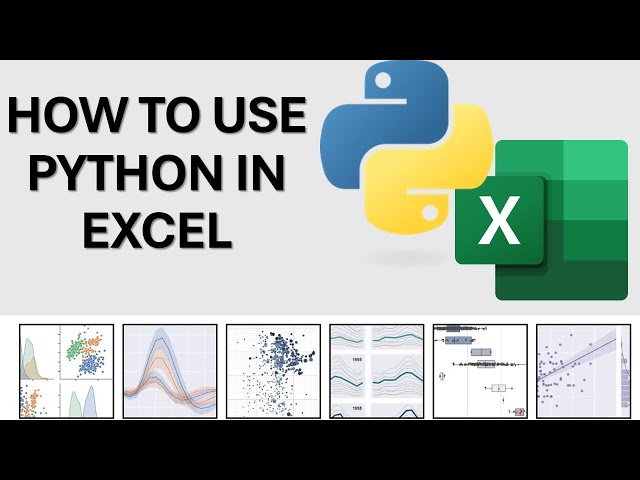
See how Python is transforming Excel into a data powerhouse. In this video, we'll demonstrate: • The groundbreaking PY function ...
5,975 views
Seaborn Tutorial : Seaborn Full Course | Data Visualization with Python Welcome to the **Seaborn Full Course** – a ...
1,362 views
Seaborn #DataVisualization #PythonTutorial #SeabornTutorial #DataScience #PythonDataScience #LearnSeaborn #DataViz ...
93 views
Learn how to create and customize data visualizations using Seaborn in Python. This tutorial covers essential plotting techniques ...
748 views
8 months ago
This project performs a step-by-step Exploratory Data Analysis (EDA) on the famous Titanic dataset using Python libraries such as ...
219 views
Do you want to learn how to turn real-world data into beautiful charts in just a few lines of Python? In this beginner-friendly video, ...
37 views
Learn how to perform a complete Weather Data Analysis project in Python using Pandas, Matplotlib, and Seaborn. In this tutorial ...
522 views
2 months ago
Stay tuned: https://www.youtube.com/@CodeAiFlow?sub_confirmation=1 ☕️ I'm glad I can share all this for free! If it helped you ...
73 views
Uber Data Analysis Project | Python | Pandas, NumPy, Matplotlib, Seaborn In this project, I perform an in-depth analysis of Uber's ...
189 views
Welcome to Omar Tood Unlock the world of Data Science, Machine Learning, and Artificial Intelligence. On this channel, you'll ...
673 views
4 months ago
Final Project! In this video, we combine everything learned — data analysis, visualization, and dashboard building in Python.
1,106 views
In this video, explore the complete basics of Seaborn, one of Python's most powerful and easy-to-use data visualization libraries!
6 views
Master Data Visualization with Python in Just 30 Minutes! In this crash course, you'll learn the fundamentals of Matplotlib and ...
184 views
11 months ago
Unlock the power of Histograms in Python using Matplotlib and Seaborn! Learn to create, customize, and interpret histograms ...
64 views
In this video, we dive into Exploratory Data Analysis (EDA) using powerful Python libraries like pandas, numpy, matplotlib, and ...
3,294 views
Welcome today we're diving into Seabour a powerful Python library designed for creating beautiful and informative statistical plots ...
40 views


![Learn Seaborn - Python Data Visualization made easy | Data Science with Python [Part 1]](/api/proxy/image?url=https%3A%2F%2Fi.ytimg.com%2Fvi%2FY-1C6zxBLfs%2Fsddefault.jpg)