ViewTube

ViewTube
Sign inSign upSubscriptions
Filters

Upload date

Type

Duration

Sort by

Features

Reset

370 results

Mathew K Analytics
Interactive Data Filtering in Bokeh: Building Dynamic Visualizations with Python

Learn how to use Python and Bokeh to interactively filter and visualize time series data. This tutorial covers loading real-world ...

13:56
Interactive Data Filtering in Bokeh: Building Dynamic Visualizations with Python

25 views

4 months ago

Smart bytes
Bokeh

Interactive Bokeh Dashboard – Student Performance Analysis In this video, I demonstrate an interactive data visualization ...

0:22
Bokeh

3 views

6 months ago

Houslast DJ
AI-powered cinema bokeh effect on any video (Python local run)

https://github.com/houslast/CinemaBokehAI- Aplicação web em Python que: Recebe um vídeo (mp4/mov/avi) Gera depth map por ...

2:03
AI-powered cinema bokeh effect on any video (Python local run)

11 views

12 days ago

Statyssey
Simple Dashboard using Bokeh python | Trend line

Creating a simple dashboard using python Bokeh. Python Bokeh is a module that allows us to build dynamic and static ...

29:31
Simple Dashboard using Bokeh python | Trend line

30 views

11 months ago

Makangdiar
006 Visualisation avancées des données avec Bokeh en Python

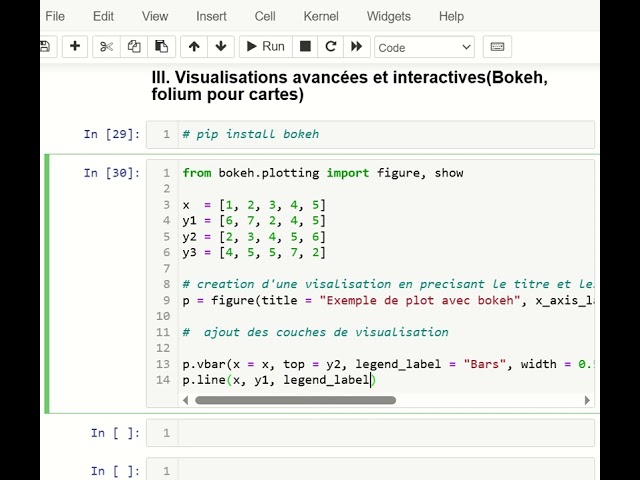
L'utilisation de la bibliothèque Bokeh pour la representation graphique des données en python.

35:05
006 Visualisation avancées des données avec Bokeh en Python

11 views

1 month ago

AI Sciences
Python Bokeh Tutorial | Create Interactive Plots, Multiplots & Grid Layouts

Course link: https://aicourse.thinkific.com/courses/data-understanding-and-data-visualization-with-python 00:00 – Introduction to ...

17:22
Python Bokeh Tutorial | Create Interactive Plots, Multiplots & Grid Layouts

219 views

5 months ago

Elmar Bergeler
Bokeh Tutorial

Using the Bokeh Python library to make an interactive line chart.

27:30
Bokeh Tutorial

10 views

4 months ago

freemediatools
Python 3 Bokeh Library Script to Plot CSV Data as Interactive & Colorful HTML Web Charts in Browser

Get the full source code of application here: ...

4:30
Python 3 Bokeh Library Script to Plot CSV Data as Interactive & Colorful HTML Web Charts in Browser

20 views

8 months ago

Emmanuel Jesuyon Dansu
29/17. Making Dashboards with Bokeh

In this video, we explore how to create interactive, visually appealing dashboards using Bokeh, a powerful Python library for data ...

20:01
29/17. Making Dashboards with Bokeh

68 views

8 months ago

The Debug Zone
Understanding Bokeh's DateRangeSlider: A Comprehensive Guide and Solutions

In this video, we delve into the powerful DateRangeSlider feature of Bokeh, a popular Python library for interactive data ...

1:55
Understanding Bokeh's DateRangeSlider: A Comprehensive Guide and Solutions

2 views

5 months ago

Geeky Script
How to Install Bokeh with latest Python 3.13 on Windows 10/11 [2025 Update] Bokeh Tutorial

Hello Everyone! Today, in this video, I am going to step-by-step guide you on How to install Bokeh with the latest Python 3.13 on ...

3:16
How to Install Bokeh with latest Python 3.13 on Windows 10/11 [2025 Update] Bokeh Tutorial

199 views

4 months ago

NASIM ISLAM
Portrait Video Baimint Lookbook Canon EosR5 + RF 70-200F2.8L | editing video

Portrait Video Baimint Lookbook Canon EosR5 + RF 70-200F2.8L | editing video.

0:35
Portrait Video Baimint Lookbook Canon EosR5 + RF 70-200F2.8L | editing video

2,703,574 views

2 months ago

NeuralNine
Modern Data Dashboards with Python & Tkinter

Today we learn how to build modern data dashboards in Python with Tkinter and Matplotlib.

49:54
Modern Data Dashboards with Python & Tkinter

12,230 views

7 months ago

CoCalc by SageMath, Inc.
How to Use Bokeh for Basic Plotting in Jupyter with CoCalc

What You'll Learn: Learn the basics of creating interactive plots using Bokeh in a Jupyter notebook on CoCalc. This tutorial ...

12:22
How to Use Bokeh for Basic Plotting in Jupyter with CoCalc

115 views

8 months ago

SciPy
Eswaramoorthy, Metzger, & Van de Ven - Interactive data visualizations with Bokeh | SciPy 2024

Bokeh is a library for interactive data visualization. You can use it with Jupyter Notebooks or create standalone web applications, ...

4:06:40
Eswaramoorthy, Metzger, & Van de Ven - Interactive data visualizations with Bokeh | SciPy 2024

58 views

7 months ago

Learn IT Free: Careers & Tech with Vi-2s-Dk
TOP Python GIS Libraries SHOWDOWN: Folium, Plotly, GeoPandas, Bokeh!

BUILD Interactive Dashboards with TOP Python GIS Libraries! #datascience #datavisualization #gis #python #Folium #Plotly ...

9:44
TOP Python GIS Libraries SHOWDOWN: Folium, Plotly, GeoPandas, Bokeh!

816 views

10 months ago

The Debug Zone
Running Bokeh Widget Python Callbacks in Jupyter Notebook: A Complete Guide

In this video, we dive into the world of interactive data visualization using Bokeh widgets in Python. Specifically tailored for Jupyter ...

1:30
Running Bokeh Widget Python Callbacks in Jupyter Notebook: A Complete Guide

7 views

8 months ago

PyPlus
How Can You Create an Interactive Colorful Scatter Plot in Python Using Bokeh?

In this video, you'll learn how to create a fully interactive scatter plot in Python using Bokeh — one of the most powerful ...

2:40
How Can You Create an Interactive Colorful Scatter Plot in Python Using Bokeh?

2 views

2 months ago

vlogize
How to Effectively Use Bokeh with Python for Dynamic Chart Highlighting

Learn how to utilize Bokeh's HoverTool in Python to create engaging charts, complete with dynamic line highlighting for better ...

1:46
How to Effectively Use Bokeh with Python for Dynamic Chart Highlighting

3 views

3 months ago

AI Evolutionary
Create an Interactive Annotated Timeline Using Python | Data Visualization with Matplotlib & Plotly

Learn how to create an interactive Annotated Timeline using Python! In this tutorial, we will explore Matplotlib, Plotly, and Pandas ...

1:29
Create an Interactive Annotated Timeline Using Python | Data Visualization with Matplotlib & Plotly

170 views

10 months ago

Emmanuel Jesuyon Dansu
28/16. Data Visualization with Bokeh

In this video, we explore how to create stunning, interactive data visualizations using Bokeh, a powerful Python library. Learn how ...

23:08
28/16. Data Visualization with Bokeh

54 views

8 months ago

vlogize
How to Detect ColumnDataSource Changes in Bokeh with Python

Learn how to effectively trigger Python code when a `ColumnDataSource` is updated in Bokeh, using the right methods to ensure ...

1:27
How to Detect ColumnDataSource Changes in Bokeh with Python

2 views

8 months ago

vlogize
Understanding Bokeh: Why You Can't Manually Apply a NumeralTickFormatter in Python

Explore the limitations of using Bokeh in Python, specifically why you cannot manually apply the `NumeralTickFormatter`.

1:22
Understanding Bokeh: Why You Can't Manually Apply a NumeralTickFormatter in Python

1 view

8 months ago

Miroslav Reiter - VITA Academy
Online kurz Interaktívne Vizualizácie Dát - Ako začať s knižnicou Bokeh Python?

Absolvujte celý online kurz na ➡️ https://www.vita.sk/online-kurz-kniznica-bokeh-grafy/ Online kurz Knižnica Plotly je pre vás ...

1:14:39
Online kurz Interaktívne Vizualizácie Dát - Ako začať s knižnicou Bokeh Python?

104 views

11 months ago

The Oxford Files
Python Basics | Session 4-B | Library and Package | Matplotlib and Bokeh
11:40
Python Basics | Session 4-B | Library and Package | Matplotlib and Bokeh

61 views

4 months ago