Upload date
All time
Last hour
Today
This week
This month
This year
Type
All
Video
Channel
Playlist
Movie
Duration
Short (< 4 minutes)
Medium (4-20 minutes)
Long (> 20 minutes)
Sort by
Relevance
Rating
View count
Features
HD
Subtitles/CC
Creative Commons
3D
Live
4K
360°
VR180
HDR
42,500 results
Building a data visualization with Bokeh involves the following steps: 1. Prepare the data 2. Determine where the visualization will ...
4,402 views
6 years ago
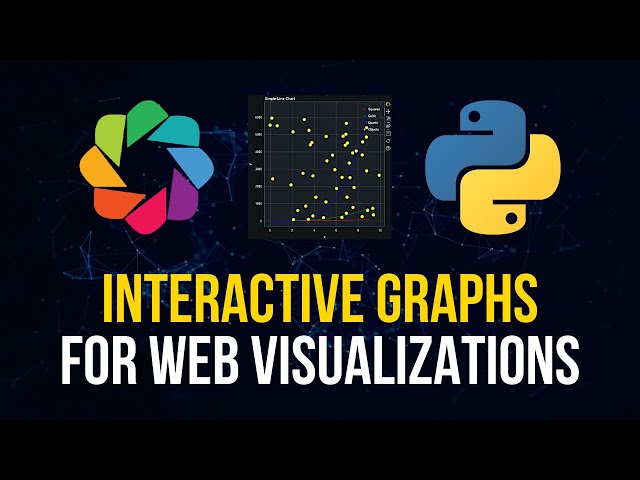
Today we learn how to create professional interactive web visualizations with Bokeh in Python.
43,027 views
3 years ago
Learn how to create interactive and complex visualizations using Plotly and Bokeh libraries in Python. Music credits: Lost In ...
849 views
2 years ago
In this video Rob, a Kaggle Grandmaster, quickly and humorously walks through each of the popular plotting and data ...
109,081 views
4 years ago
In this video, you will add and style a legend and a headline. You will also add additional information to your plot by including ...
576 views
Bokeh looks promising for my data visualization projects. Animation can be achieved by updating the data source on the server ...
4,455 views
10 years ago
Data Scientist Masters Program (Discount Code - YTBE15) ...
19,294 views
Tired of Matplotlib's outdated approach? Discover these 5 powerful Python libraries that offer cleaner, more intuitive, and often ...
8,071 views
1 year ago
Get a look at our course on data science and AI here: https://bit.ly/3thtoUJ ...
1,029 views
5 years ago
INTELIGENCIA ARTIFICIAL EN EXCEL? - WORKSHOP GRATUITO 2 DÍAS DE FORMACIÓN 29 Y 30 DE OCTUBRE de 2024 ...
2,501 views
PyData Dallas 2015 00:00 Welcome! 00:10 Help us add time stamps or captions to this video! See the description for details.
12,363 views
You can see the column data source with the standard Python like dictionaries pandas dataframes lists or non P arrays but using ...
425 views
7 years ago
In this video tutorial , you will learn how to visualize the stock prices for Apple, Facebook, Google and Microsoft using Bokeh ...
3,064 views
"Speaker: Chalmer Lowe Bokeh is a powerful data visualization library that creates fully interactive plots and integrates well with ...
9,943 views
8 years ago
Bokeh ( http://bokeh.pydata.org/en/latest/ ) es una librería de visualización de datos con una interfaz concisa y elegante que ...
2,464 views
Steven C. Howell http://pyohio.org/schedule/presentation/288/ Bokeh is a powerful library for creating interactive data ...
6,968 views
Data Visualization using Bokeh Explained! | Python course for beginners | Techmaima # Bokeh is a 3rd party library - we can use ...
147 views
This talk largely follows a technical blog post by the same author. First, and because my company (ASML) has not been ...
4,376 views
Bokeh is a python library to create interactive data visualizations. In this tutorial, we have explained how to create interactive ...
2,249 views
This is video 10 of our series on scraping data to storing it to visualizing it. In this clip, we take our data we scraped from Craigslist ...
6,752 views
bokeh #python #interactivechart #scatterplot.
295 views
In this video we will get started with data visualization in Python by creating a top horsepower chart using the Bokeh library Code: ...
170,348 views