Upload date
All time
Last hour
Today
This week
This month
This year
Type
All
Video
Channel
Playlist
Movie
Duration
Short (< 4 minutes)
Medium (4-20 minutes)
Long (> 20 minutes)
Sort by
Relevance
Rating
View count
Features
HD
Subtitles/CC
Creative Commons
3D
Live
4K
360°
VR180
HDR
93 results
Bring your scientific data to life with animated visualizations! Learn how to create professional animations in Python using ...
0 views
6 days ago
The logistic map equation: x(n+1) = r·x(n)·(1-x(n)). As r increases, the system transitions from stable to oscillating to chaotic ...
18 views
3 weeks ago
Rain by Twin Musicom is licensed under a Creative Commons Attribution 4.0 license. https://creativecommons.org/licenses/by/4.0/ ...
13 views
Matplotlib: The Secret Power Behind Every Python Graph (FULL Explanation)” ✓ DESCRIPTION Have you ever looked at a ...
In this video i have used python with matplotlib and numpy library to illustrate beautiful geometric animation. #python #panda ...
8 days ago
This demo showcases how 3D transformations: rotation, translation, scaling, and reflection, including the mathematical principles ...
42 views
1 month ago
Pi if it were plotted points on a chart by 2 rotating lines. Pretty common thing, but I just learned how MatPlotLib (what you use to ...
Coherent Point Drift Algorithm Explained | Deformable Point Cloud Registration Tutorial | Y = Y + GW Master the Coherent Point ...
157 views
2 weeks ago
This project demonstrates the 3D visualization of a Torus (a donut shape) using Python and the Matplotlib. Instead of using ...
4 weeks ago
This video shows the population growth of India from 1905 to 2025 using a smooth animated area chart. Population values are ...
65 views
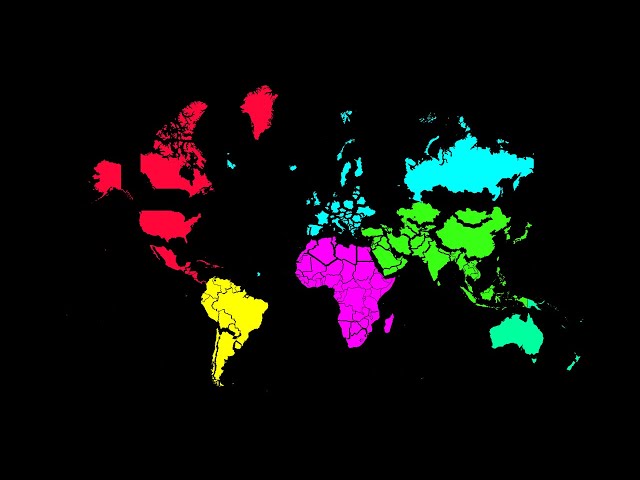
I always adored visualizations comparing various projections vs the true size of the countries, and I have been planning to create ...
66 views
1 day ago
Welcome to our Python Graphics Design Tutorial! Are you ready to unleash your creativity through Python programming?
70 views
2 days ago
In this tutorial, you'll learn how to create a smooth, dynamic, animated bar chart in Python using Plotly — one of the most powerful ...
4 views
This video presents a dynamic Python-generated visualization of the Global Index Race from 2020 to 2025, comparing the ...
159 views
Ever wanted to create stunning visuals but weren't sure where to start? This video is your ultimate guide to unlocking your graphic ...
Welcome to Sha Graphics 786, where the canvas of creativity meets the code of innovation. Embark on an immersive journey into ...
5 days ago
This video shows two plays from the NFL Big Data Bowl 2026 dataset. Using a custom metric called DSS (Defensive Swarm ...
Python animation with matplotlib (dual-plot visualisation). * Probability functions using sigmoid curves. * Parametric equations for ...
112 views
7 days ago
5 views
2 views