ViewTube

ViewTube
Sign inSign upSubscriptions
Filters

Upload date

Type

Duration

Sort by

Features

Reset

59 results

GIS Developer
Python Geospatial Visualization EXPLAINED | GeoPandas, Matplotlib & Plotly

In this tutorial, we explore how to visualize geospatial data in Python without using Folium — a common challenge for GIS ...

27:16
Python Geospatial Visualization EXPLAINED | GeoPandas, Matplotlib & Plotly

0 views

21 hours ago

Burma Code Hub
Matplotlib Histograms and Subplots
18:23
Matplotlib Histograms and Subplots

0 views

14 hours ago

Intellipaat
Data Analytics Course for Beginners 2026 | Data Analytics Full Course Free | Intellipaat

In this video, you'll get a complete introduction to data analytics, starting from the basics and gradually moving toward practical, ...

9:11:26
Data Analytics Course for Beginners 2026 | Data Analytics Full Course Free | Intellipaat

9,032 views

Streamed 3 hours ago

Intellipaat
Data Analytics Full Course From Scratch 2026 | Learn Data Analysis for Free | Intellipaat

In this video, you'll get a complete introduction to data analytics, starting from the basics and gradually moving toward practical, ...

10:10:17
Data Analytics Full Course From Scratch 2026 | Learn Data Analysis for Free | Intellipaat

952 views

4 hours ago

AI Research Roundup
PaperBanana: Automating Research Illustrations

In this AI Research Roundup episode, Alex discusses the paper: 'PaperBanana: Automating Academic Illustration for AI Scientists' ...

4:30
PaperBanana: Automating Research Illustrations

45 views

15 hours ago

SummarizedAI
Pandas Explained: From Raw Data to Insights #pandas #python #pythonpandas #pandastutorial #ai

Welcome back to Summarized AI ! If you're working with data in Python—whether it comes from CSV files, Excel sheets, ...

7:00
Pandas Explained: From Raw Data to Insights #pandas #python #pythonpandas #pandastutorial #ai

0 views

43 minutes ago

Dive in Data
SQL - Customers Who Returned At Least One Item | SQL Top 75 Coding Interview Questions

Download the E-Commerce database used in this video here: ...

5:39
SQL - Customers Who Returned At Least One Item | SQL Top 75 Coding Interview Questions

0 views

4 hours ago

MP Board Commerce Class12th - Arivihan
MP Board Class 12 - Data Handling using Pandas & and Plotting Data (IP) अंतिम युद्ध🔥 | Maha Revision

MP Board Class 12 - Data Handling using Pandas & and Plotting Data (IP) अंतिम युद्ध | Maha Revision ...

1:56:35
MP Board Class 12 - Data Handling using Pandas & and Plotting Data (IP) अंतिम युद्ध🔥 | Maha Revision

535 views

Streamed 1 day ago

Simplilearn
Python for Data Science Full Course 2026 [Free] | Learn Data Science With Python | Simplilearn

Applied Generative AI Specialization, delivered by Simplilearn in collaboration with Purdue University ...

11:55:00
Python for Data Science Full Course 2026 [Free] | Learn Data Science With Python | Simplilearn

800 views

Streamed 16 hours ago

IT大学こーチャンネル
データが見える化!Pythonで美しいグラフを描く方法【初心者OK】

データを見える化!Pythonで美しいグラフを作る方法 #プログラミング #python #初心者 import japanize_matplotlib # 日本語 ...

16:25
データが見える化!Pythonで美しいグラフを描く方法【初心者OK】

0 views

15 hours ago

Hire Ready
Day 33 – Plotly Interactive Visualizations | AI Course in English

Day 33 of your Complete AI Course in English unlocks Plotly – the interactive plotting library powering Jupyter dashboards, web ...

9:51
Day 33 – Plotly Interactive Visualizations | AI Course in English

31 views

6 hours ago

Marble Channel
Marble Race Practice - Lesson 210

New Season is Here! It's funny, it's silly, it's super fun! Get ready for laughs and wacky moments. Subscribe and join the fun! used: ...

6:28
Marble Race Practice - Lesson 210

0 views

6 hours ago

juan bosh garcia
Por qué tu código es un caos y cómo el "Modo Manga" lo arregla todo.

Cansado de que tus proyectos de hardware terminen en un mar de cables y código espagueti? En este vídeo revelamos la ...

5:54
Por qué tu código es un caos y cómo el "Modo Manga" lo arregla todo.

16 views

1 day ago

Dr S Ajitha
WEEK 2  -  LECTURE 3 -  EXPLORATORY DATA ANALYSIS (EDA)

Exploratory Data Analysis (EDA) in Python is the process of examining datasets to summarize their main characteristics, often ...

13:56
WEEK 2 - LECTURE 3 - EXPLORATORY DATA ANALYSIS (EDA)

0 views

23 hours ago

Data Coaching
Power BI for Beginners – Full Starter Guide | Build Your First Dashboard Step by Step

Free Data Analyst KickStarter Pack - https://datacoaching4628.graphy.com/courses/dataanalyst-freecourse Check Data Analytics ...

45:23
Power BI for Beginners – Full Starter Guide | Build Your First Dashboard Step by Step

78 views

6 hours ago

Dive in Data
SQL - Customer's Latest Order With Order ID | Top 75 SQL Coding Interview Questions Series

Download the E-Commerce database used in this video here: ...

8:56
SQL - Customer's Latest Order With Order ID | Top 75 SQL Coding Interview Questions Series

16 views

11 hours ago

Amit Thinks
Anaconda Tutorial (2026) | Learn Python Anaconda in one video | Data Science & Analysis |Amit Thinks

This video tutorial teaches Python Anaconda with live running examples. Anaconda is useful for creating data science and ...

40:26
Anaconda Tutorial (2026) | Learn Python Anaconda in one video | Data Science & Analysis |Amit Thinks

113 views

13 hours ago

Exam Buddy
NPTEL Data Analytics with Python Week 3 Assignment Answers With Explanation  | Jan–Apr 2026

In this video, you will get NPTEL Data Analytics with Python Week 3 Assignment Answers for the January–April 2026 session.

2:47
NPTEL Data Analytics with Python Week 3 Assignment Answers With Explanation | Jan–Apr 2026

113 views

15 hours ago

PyFusion
03 02 2026 13 32 06 REC

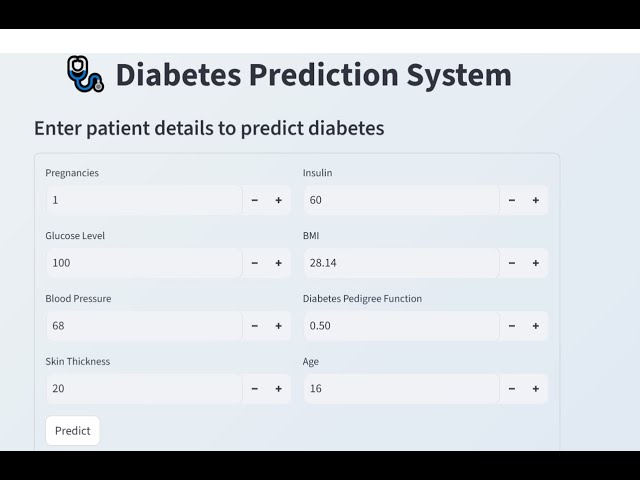
This project is focused on building a machine learning system to detect diabetes using health data such as age, BMI, blood ...

1:37
03 02 2026 13 32 06 REC

0 views

9 hours ago

Kenu Heo
pyllm study summary - 2026 02 03 20 11 12

This video recaps the key findings from sessions 1-13, which took place in January, and delves into productivity enhancements ...

16:22
pyllm study summary - 2026 02 03 20 11 12

13 views

5 hours ago