Upload date
All time
Last hour
Today
This week
This month
This year
Type
All
Video
Channel
Playlist
Movie
Duration
Short (< 4 minutes)
Medium (4-20 minutes)
Long (> 20 minutes)
Sort by
Relevance
Rating
View count
Features
HD
Subtitles/CC
Creative Commons
3D
Live
4K
360°
VR180
HDR
255 results
Interactive charts with Plotly Express: bubble charts with multiple variables, lines, 3D scatter plots, and how to share them ...
130 views
3w ago
Welcome to Day 201 of The Complete Python Bootcamp. In this session, you will explore how to create bar charts using Plotly.
62 views
2w ago
Welcome to Day 196 of The Complete Python Bootcamp. In this session, you will explore the basics of Plotly, a powerful Python ...
82 views
Learn how to build interactive charts in Python with Plotly Express 7.1 on Python 3.13 and pandas 3.1. We type a bubble chart of ...
8 views
1d ago
DESCRIPTION Go from a simple Python chart to a working live dashboard—with real data at every step. Join Learn with Yulia for ...
67 views
4w ago
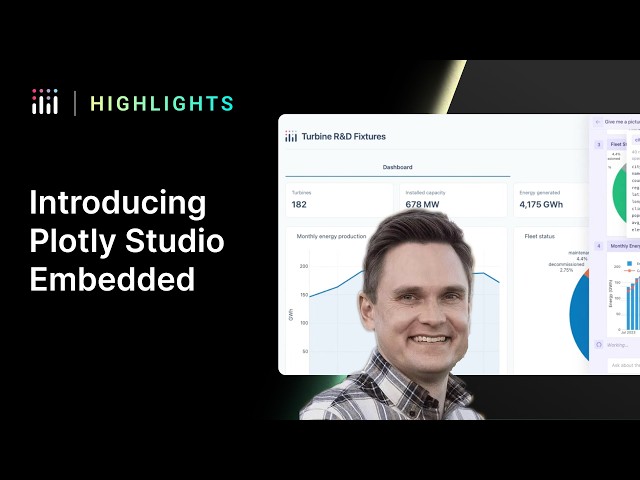
Most dashboards only answer the questions you anticipated when you built them. Plotly Studio Embedded adds AI insights to your ...
215 views
6d ago
Can Plotly Studio turn a raw dataset into useful charts and an interactive dashboard faster than a traditional workflow?
616 views
Welcome to Day 198 of The Complete Python Bootcamp. In this session, you will explore Plotly Express, a high-level interface ...
69 views
Create readable Plotly figures from DataFrames. Explain axes, units and trace encodings, then demonstrate legends, 3D rotation ...
7 views
7d ago
Code: https://github.com/patrickkirbyjr/DataPat/blob/main/plotly_histo.ipynb.
23 views
10d ago
In this session, you will explore how to quickly change the theme of your charts using Plotly and Dash. You'll learn how Plotly ...
140 views
Dash in 20 minutes: your first app, start to finish. New to Dash? Start here. We go from five lines of code to a styled, interactive app: ...
392 views
Code: https://github.com/patrickkirbyjr/DataPat/blob/main/plotly_line.ipynb.
11 views
5d ago
Build Beautiful, Interactive Web Charts with Python & Plotly.
The same graph in Matplotlib and Plotly: differences, advantages, and when to use each library. Part of the free course ...
40 views
Code: https://github.com/patrickkirbyjr/DataPat/blob/main/plotly_interactive.ipynb.
17 views
12d ago
Code: https://github.com/patrickkirbyjr/DataPat/blob/main/plotly_box.ipynb.
2 views
3d ago
Learn how to create stunning dashboards with Plotly Dash. In this step-by-step tutorial, we'll cover the basics of building ...
9 views
LESSON OVERVIEW ━━━━━━ Lesson 3 - Introduction to Pandas (Part 2: Visualizing Data with Plotly) In this lesson you will ...
Welcome to Day 194 of The Complete Python Bootcamp. In this session, you will explore how to create basic interactivity in Dash ...
131 views