Upload date
All time
Last hour
Today
This week
This month
This year
Type
All
Video
Channel
Playlist
Movie
Duration
Short (< 4 minutes)
Medium (4-20 minutes)
Long (> 20 minutes)
Sort by
Relevance
Rating
View count
Features
HD
Subtitles/CC
Creative Commons
3D
Live
4K
360°
VR180
HDR
7,209,528 results
matlab plot 3d
matlab subplot
matlab 2d plotting
matlab figure
This tutorial illustrates how to generate 2D plots in Matlab. Topics and timestamps: 0:00 – Introduction 2:35 – Using the 'plot' ...
175,869 views
7 years ago
How to Make a Plot and Graph in MATLAB! MATLAB calls graphs plots. First time using MATLAB to plot? This video is the first in a ...
30,384 views
3 years ago
Get more lessons like this at http://www.MathTutorDVD.com Learn how to plot any function on an x-y plan (Cartesian plan) in ...
308,463 views
Learn how to create and interact with plots in MATLAB®, which is an important part of creating MATLAB code. Anyone – from ...
44,696 views
6 years ago
In this MATLAB tutorial video, you'll learn the fundamentals of 2D plotting. In this step-by-step video, I'll guide you through creating ...
4,956 views
2 years ago
In this video, you will learn how to create a script file for an animation plot in MATLAB. you will see different appearances of the ...
12,033 views
4 years ago
matlab #matlabtutorials #programmingtutorials #matlabsimulation #surf #programming #controltheory #controlengineering ...
28,582 views
Discover how to access array elements using a single index in this comprehensive MATLAB tutorial on linear indexing. In this ...
2,678 views
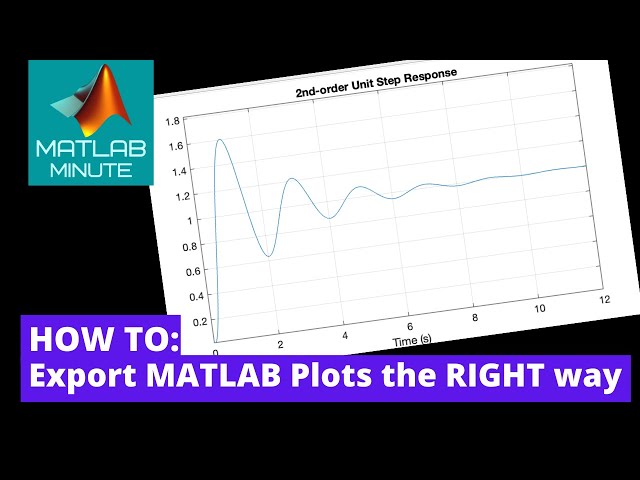
A brief explanation of the various proper and improper ways to export your plots from MATLAB. Your lab reports will thank you for ...
39,655 views
5 years ago
Here's a description of two easy ways to make surface plots in Matlab, including step-by-step instructions.
33,729 views
Matlab is a very powerful tool for scientific analysis and used in engineering for solving the complex problems mathematically and ...
105,815 views
In this tutorial, learn how to enhance your plots by adding special characters, Greek letters, and mathematical symbols using ...
2,818 views
How to Plot multiple graphs in matlab using subplot command and hold on command. Multiple plotting in matlab is part of ...
102,877 views
How to Make a 2D Scatter Plot in MATLAB! Change datapoint size and color, in addition to plotting on the x and y axis.
8,933 views
This video explains how to display multiple plots in the same figure using the subplot function. Buy my MATLAB/SIMULINK Course ...
156,359 views
8 years ago
Learn the essentials of plot formatting in MATLAB with this comprehensive tutorial. Discover how to create and modify plots, adjust ...
5,471 views
How exel data is imported in matlab, how to plot imported exel data in matlab, how to plot experimental data and on the same plot ...
102,538 views
MATLAB 3D plotting. view(2) and view(3) commands for going from 2 to 3D views. Creating a meshgrid for the foundation of ...
33,694 views
MATLAB has various functions that can be used to display data graphically. This video shows how to use some of the Data ...
20,518 views
Engineers and scientists often work with complex, multidimensional data that is difficult to interpret in raw tables. Surface plots in ...
1,895 views
1 month ago
In this video, you will learn how to 3d plot in matlab with example. The video is on 3d plot matlab example. It is very common to ...
61,770 views
This tutorial illustrates how to generate 3D plots in Matlab. We investigate the concept of how to generate a discrete ...
248,893 views
Learn the principal characteristics of a Bode plot in this MATLAB® Tech Talk by Carlos Osorio. This video explains how a Bode ...
3,377 views
3 months ago
A beginner-friendly tutorial to help you make great Matlab figures for your (LaTeX) scientific paper or your PhD thesis, also in ...
36,902 views
You can interactively create and explore visualizations for your data with the Create Plot Live Editor task. Choose visualizations ...
6,500 views
A brief example on how to use MATLAB to plot multiple functions on the same figure, declare time vectors and step sizes, label x ...
82,159 views
How to plot graph in MATLAB or learn 2D plotting in matlab using Plotting Function in MATLAB is explained in MATLAB Tutorial ...
124,629 views