ViewTube

ViewTube
Sign inSign upSubscriptions
Filters

Upload date

Type

Duration

Sort by

Features

Reset

387 results

Corporate Connexion
Introduction to Data Visualization with Matplotlib | Python Beginner’s Guide

FREE EXCLUSIVE WORKSHOP ALERT! CLICK HERE TO JOIN THE MEETING FOR FREE: ...

10:05
Introduction to Data Visualization with Matplotlib | Python Beginner’s Guide

13 views

8 hours ago

Corporate Connexion
Matplotlib Hands-On Coding Workshop | Master Data Visualization in 1 Hour!

Welcome to the Matplotlib Hands-On Coding Workshop! In this session, we will learn data visualization from scratch using Python ...

13:55
Matplotlib Hands-On Coding Workshop | Master Data Visualization in 1 Hour!

8 views

8 hours ago

AI Evolutionary
How to Create Gridlines in Python Plots  | Matplotlib Guide

How to Create Gridlines in Python Plots Matplotlib Guide In this video, you will learn how to create gridlines in Python using ...

0:53
How to Create Gridlines in Python Plots | Matplotlib Guide

42 views

5 days ago

Youven
Animate Scientific Data in Python | Matplotlib Animation Tutorial for Researchers

Bring your scientific data to life with animated visualizations! Learn how to create professional animations in Python using ...

41:13
Animate Scientific Data in Python | Matplotlib Animation Tutorial for Researchers

0 views

2 days ago

Youven
Matplotlib Sketch Style Plots for Research Presentation (Complete Python Guide)

Learn how to create stunning hand-drawn sketch style plots in Matplotlib that make your research figures stand out!

10:16
Matplotlib Sketch Style Plots for Research Presentation (Complete Python Guide)

0 views

2 days ago

Depict Labs
This isn’t Matplotlib – it’s Blender 4 rendering a 3D scatter plot directly from a CSV file.

This isn't Matplotlib – it's Blender 4 rendering a 3D scatter plot directly from a CSV file. A Python script inside Blender reads the ...

0:42
This isn’t Matplotlib – it’s Blender 4 rendering a 3D scatter plot directly from a CSV file.

1,069 views

6 days ago

AI Evolutionary
How to Create a Filled Square Pattern in Python Using Matplotlib

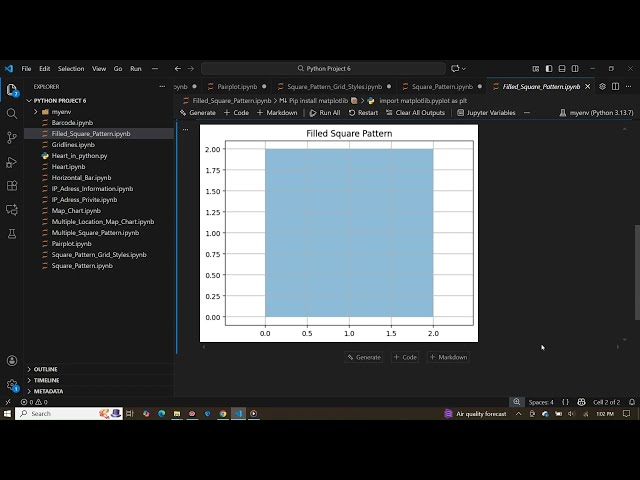
How to Create a Filled Square Pattern in Python Using Matplotlib In this video, you will learn how to create a filled square pattern ...

1:01
How to Create a Filled Square Pattern in Python Using Matplotlib

28 views

4 days ago

DataBoosters
How to change the color palette in your Matplotlib charts | Python MATPLOTLIB part 2

In this video, you'll learn how to change the color palette in your Matplotlib charts—a simple way to improve the aesthetics ...

11:09
How to change the color palette in your Matplotlib charts | Python MATPLOTLIB part 2

22 views

6 days ago

PyPlus
How to Visualize Programming Language Trends Using Python (2014–2024)?

In this video, you'll learn how to visualize programming language popularity trends using Python and Matplotlib. We plot ranking ...

6:05
How to Visualize Programming Language Trends Using Python (2014–2024)?

0 views

4 days ago

Intellipaat
Data Analytics Full Course FREE | Data Analytics Course 2026 | Intellipaat

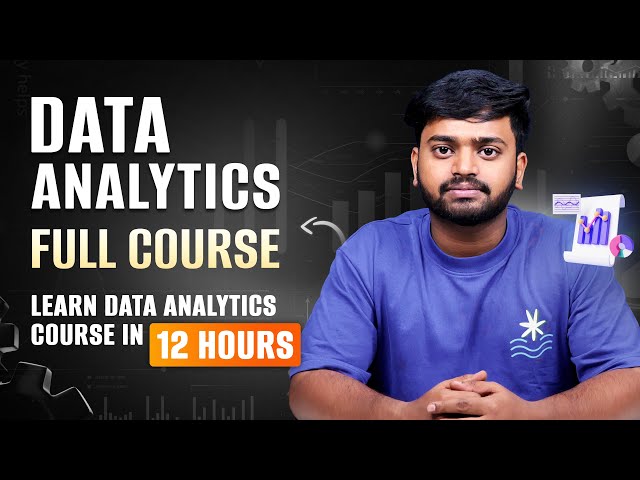
If you want to break into data analytics or strengthen your existing skills, this Data Analytics Full Course FREE by Intellipaat, ...

11:36:34
Data Analytics Full Course FREE | Data Analytics Course 2026 | Intellipaat

4,982 views

Streamed 2 hours ago

PK Technical Channel
Create Student Marks Bar Chart Using Python Matplotlib (Beginner Friendly)

Python Matplotlib Bar Chart | Student Marks Visualization In this video, you will learn how to create a bar chart using Python and ...

1:21
Create Student Marks Bar Chart Using Python Matplotlib (Beginner Friendly)

3 views

7 days ago

Sayyed Nasar Ali
Data Visualization with Matplotlib & Seaborn | Beginner Friendly

sayyednasarali #DataVisualization #Python #Matplotlib #Seaborn #DataScience #BeginnerPython #SchoolLevel #PythonTutorial ...

12:01
Data Visualization with Matplotlib & Seaborn | Beginner Friendly

47 views

5 days ago

Makuni Technologies
Become a DATA SCIENCE PRO in UNDER 45 MINUTES! Numpy, Pandas, Matplotlib

... numpy tutorial, pandas tutorial, matplotlib tutorial, data science crash course, learn data science fast, python for data analysis, ...

45:31
Become a DATA SCIENCE PRO in UNDER 45 MINUTES! Numpy, Pandas, Matplotlib

46 views

6 days ago

Sivanu Jan
🎅Matplotlib Python Tamil | Matplotlib Tutorial in Tamil #9

In this Matplotlib python Tamil tutorial, we will learn how to visualize time series data using Pandas Series and Matplotlib step by ...

10:52
🎅Matplotlib Python Tamil | Matplotlib Tutorial in Tamil #9

43 views

7 days ago

Intellipaat
Data Analytics Full Course FREE | Data Analytics Course | Intellipaat

In this Data Analytics full course, you'll begin with Python basics and progress through NumPy arrays, Pandas operations, and ...

11:39:53
Data Analytics Full Course FREE | Data Analytics Course | Intellipaat

1,630 views

11 hours ago

PyPlus
How to Create a Donut Chart in Python Using Matplotlib?

In this video, you'll learn how to create a donut chart in Python using Matplotlib. A donut chart is a stylish variation of a pie chart ...

3:16
How to Create a Donut Chart in Python Using Matplotlib?

0 views

7 days ago

PyPlus
How to Create Contour Line Plots in Python Using Matplotlib?

In this video, you'll learn how to create contour line plots in Python using NumPy and Matplotlib. Contour plots are commonly used ...

2:40
How to Create Contour Line Plots in Python Using Matplotlib?

0 views

6 days ago

CodewithPrashant
Python Data Visualization Tools

Keywords (for SEO) Python data visualization, Python charts, data visualization tools, matplotlib tutorial, seaborn plots, plotly ...

0:07
Python Data Visualization Tools

4,804 views

1 day ago

Corporate Connexion
Introduction to Data Visualization with Matplotlib In Kannada | Beginner Friendly!

Welcome to Part 1 of our Data Visualization with Matplotlib series! In this video, we will understand what data visualization is, why ...

9:23
Introduction to Data Visualization with Matplotlib In Kannada | Beginner Friendly!

12 views

2 days ago

The Debug Zone
Fixing Matplotlib Axis('tight') Not Working: Common Issues and Solutions

In this video, we dive into a common issue faced by many data visualizers using Matplotlib: the 'tight' axis not functioning as ...

1:47
Fixing Matplotlib Axis('tight') Not Working: Common Issues and Solutions

1 view

2 days ago

Sundeep Saradhi Kanthety
BERT - Encoder Only Model | Bidirectional Encoder Representation from Transformers | Generative AI

Generative AI https://www.youtube.com/playlist?list=PLLOxZwkBK52DbrnYEhNQHjDrtJeqlmAeH R PROGRAMMING ...

7:55
BERT - Encoder Only Model | Bidirectional Encoder Representation from Transformers | Generative AI

109 views

7 hours ago

ChaloSeekhein
Matplotlib in Python Explained | Create Graphs, Charts & Plots Easily #placementpreparation

... Pie Chart ✓ Real-world examples of data visualization ✓ Matplotlib for Data Science & ML interviews This Matplotlib tutorial is ...

1:24
Matplotlib in Python Explained | Create Graphs, Charts & Plots Easily #placementpreparation

66 views

1 day ago

Python Tyro
Plotting With PyPlot Class XII  |One Shot | Informatics Practices | matplotlib | Data Visualization

Online CBSE Tuition & Doubt Clarification Sessions for Class 11 & 12 – Computer Science & Informatics Practices Contact: ...

15:08
Plotting With PyPlot Class XII |One Shot | Informatics Practices | matplotlib | Data Visualization

23 views

4 days ago

MachineLearnAthon
Tutorial on Data preparation and visualization

Get started with data analysis in Python using Jupyter Notebook! This tutorial introduces essential libraries — NumPy, pandas, ...

11:25
Tutorial on Data preparation and visualization

0 views

2 days ago

Däniel ebrz
1.2.Foundations of Computer Vision and Image Processing

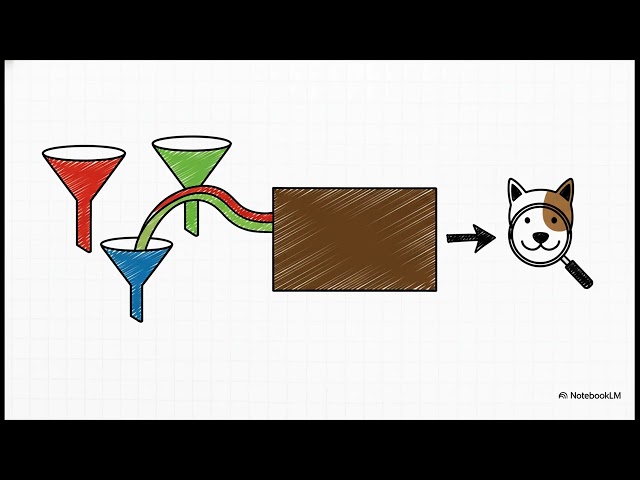
These educational documents introduce the fundamentals of image processing and computer vision using Google Colab.

6:02
1.2.Foundations of Computer Vision and Image Processing

9 views

4 days ago