Upload date
All time
Last hour
Today
This week
This month
This year
Type
All
Video
Channel
Playlist
Movie
Duration
Short (< 4 minutes)
Medium (4-20 minutes)
Long (> 20 minutes)
Sort by
Relevance
Rating
View count
Features
HD
Subtitles/CC
Creative Commons
3D
Live
4K
360°
VR180
HDR
565 results
Learn Matplotlib from scratch in this complete beginner-friendly Python tutorial covering everything from basic plots to professional ...
33 views
2 days ago
There are many programming languages used for data analysis, including Python, MATLAB, R, C++, and Java. In this video, we ...
2 views
6 days ago
Unlock the power of Matplotlib with our step-by-step tutorial designed to boost your data visualization skills! Whether you're a ...
24 views
7 days ago
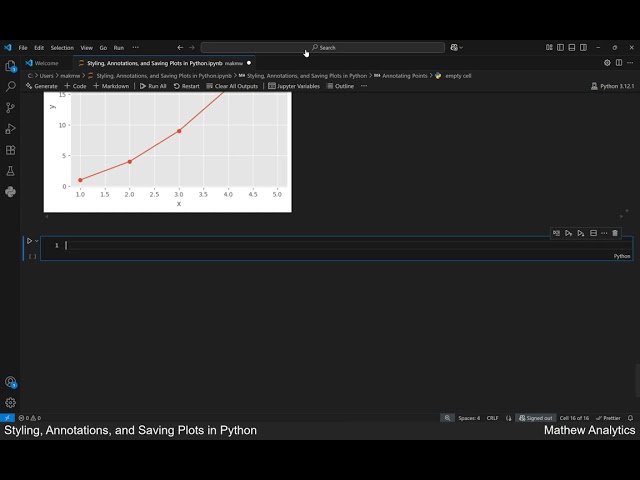
Want to take your Python data visualization skills to the next level? In this video, you'll learn how to style your plots, add impactful ...
1 view
3 days ago
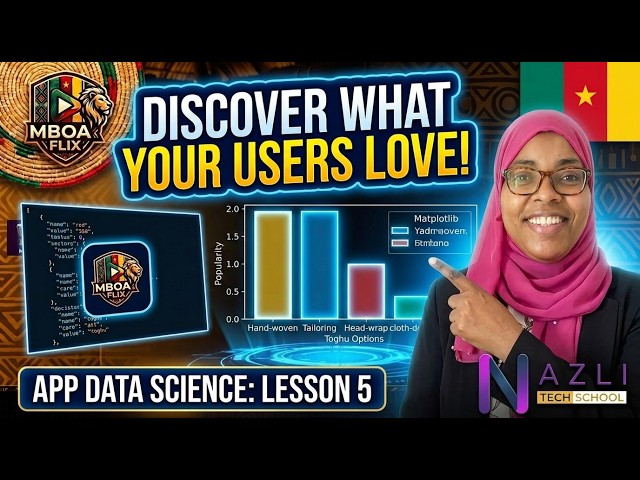
Ready to take your MBOA FLIX app from a great concept to a market leader? It's time to leverage the power of Data Science!
6 views
7 hours ago
Stack the lables of an axis with matplotlib Helpful? Please use the *Thanks* button above! Or, thank me via Patreon: ...
3 views
5 hours ago
What is the best way to represent density in matplotlib without using color? Helpful? Please use the *Thanks* button above!
0 views
Automation_Analytics_Guru Python Image Processing Project Using NumPy, Pillow (PIL), and Matplotlib In this project, ...
145 views
4 days ago
Unlock the power of data visualization with Matplotlib in Python! This video guides you through creating impactful and interactive ...
Welcome to Lesson 5 (Part 2)! Now that we've mastered backend data analytics, it's time to bring your app to life with stunning, ...
6 hours ago
Showing a few figures without stopping calculations in matplotlib Helpful? Please use the *Thanks* button above! Or, thank me via ...
18 hours ago
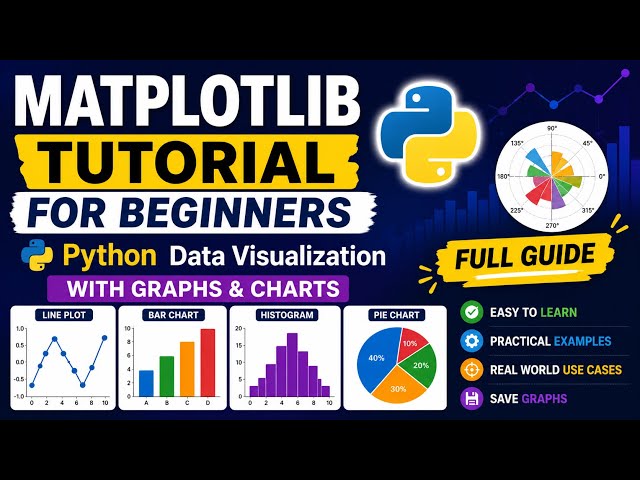
Matplotlib Tutorial for Beginners | Python Data Visualization with Graphs & Charts (Full Guide) In this video, you will learn ...
255 views
Learn how to create multiple graphs in one figure using Matplotlib subplots! In this beginner-friendly Python tutorial, you'll ...
5 days ago
Welcome to Python Se AI Tak. In this Day 5 video, we will learn NumPy, Pandas and Matplotlib basics using Jupyter Notebook ...
In this video, we explore one of the most essential libraries for data visualization in Python: Matplotlib Matplotlib allows you to ...
10 views
Visualización de datos en Python con Google Colab En esta clase aprendimos a crear gráficas en Python usando Google ...
27 views
In this video, we explore Seaborn — one of the most powerful and user-friendly libraries for data visualization in Python Built ...
This is Python Programming Lecture 58. In this lecture, we discussed advanced Matplotlib Data Visualization techniques in ...
7 views
16 hours ago
Learn how to find the square root of a number in Python without directly using sqrt(). In this video, we build the logic step by step ...
48 views