Upload date
All time
Last hour
Today
This week
This month
This year
Type
All
Video
Channel
Playlist
Movie
Duration
Short (< 4 minutes)
Medium (4-20 minutes)
Long (> 20 minutes)
Sort by
Relevance
Rating
View count
Features
HD
Subtitles/CC
Creative Commons
3D
Live
4K
360°
VR180
HDR
604 results
In this video, I explain how state management works in LangGraph, focusing on State Schemas, MessagesState, and Reducers.
39 views
2 weeks ago
8 views
How to Create Gridlines in Python Plots Matplotlib Guide In this video, you will learn how to create gridlines in Python using ...
44 views
11 days ago
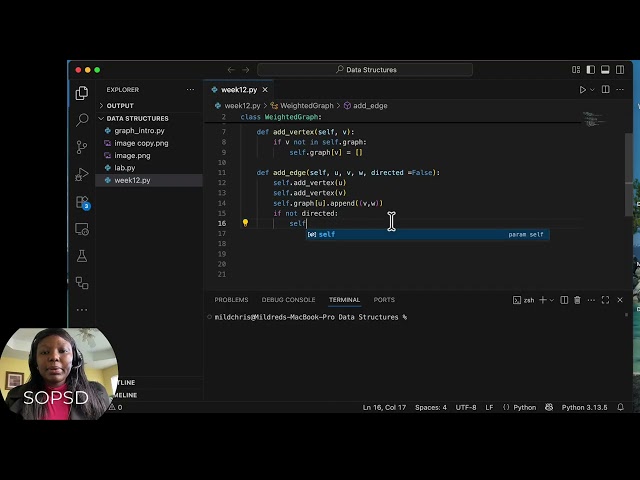
School of Programming and Software Development sop-webfb-104: Foundations of Software Development - Data Structures and ...
29 views
3 weeks ago
In this video I explain the Bellman–Ford Shortest Path Algorithm step by step and walk through clear examples on weighted ...
84 views
13 days ago
From raw text to beautiful graphs with Python! Imagine seeing something like that: ``` A B 1 A C 5 A D 2 B E 1 E F 1 F P 50 ``` and ...
48 views
4 weeks ago
Explaining graphs and the depth first search approach.
15 views
Welcome to Python Data Structures and Algorithms (DSA) Series - Diploma level! In this video we cover graphs: What are ...
0 views
... Writer Instance 45:03 - Connecting All Three Components 47:04 - Building Graph Data Structure (Nodes & Relationships) 51:40 ...
217 views
Disclaimer: This video contains a collection of important previous-year questions, arranged topic-wise for your exam preparation.
13,313 views
In this video, we build and understand a Linear Regression model step by step using Python. We generate sample data, train a ...
22 views
10 days ago
Welcome to Part 4 of our Python Graph series! In the previous videos, we have explored graphs blindly with DFS and BFS.
11,642 views
Learn how to elevate your data visualization skills and take your python graphs from bland to grand with matplotlib customization.
20 views
📌 New *DSA Sheet* Link: https://dsa.apnacollege.in/ This lecture was made with a lot of love❤️ Company wise DSA Sheet Link ...
14,992 views
This is Part 5 of our Python Graph series. In the last video, we built Dijkstra's Algorithm - the "Accountant" that finds the cheapest ...
31 views
8 days ago
Build an AI-Based Sentiment Visualizer Using Python & Google Colab! In this video, I show you how to create a complete ...
24 views
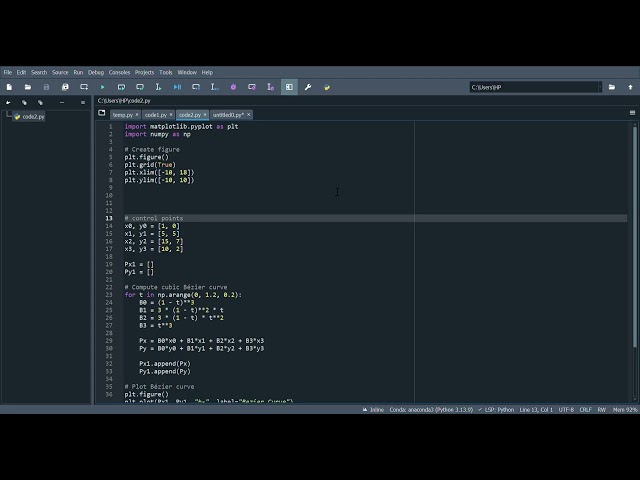
we have four control points which we use to draw a Bezier curve. p0(1, 0) p1(5, 5) p2(15, 7) p3(10, 2). we are using t=0.2 first we ...
34 views
Clone Graph - Leetcode 133 - Illustrated! - Graphs - Python (Pattern Mastery)
School of Programming and Software Development sop-webfb-104: Foundations of Software Development, Data Structures and ...
16 views
Number of Islands - Leetcode 200 - Illustrated! - Graphs - Python (Pattern Mastery)
5 views