Upload date
All time
Last hour
Today
This week
This month
This year
Type
All
Video
Channel
Playlist
Movie
Duration
Short (< 4 minutes)
Medium (4-20 minutes)
Long (> 20 minutes)
Sort by
Relevance
Rating
View count
Features
HD
Subtitles/CC
Creative Commons
3D
Live
4K
360°
VR180
HDR
960 results
Data Scientist Masters Program (Discount - YTBE15) ...
0 views
0
In this live session for Module 8 of the IBM Data Analytics Professional Certificate, IBDA 2026-04-01 cohort, we explore data ...
3 views
4 hours ago
Poland's Population Journey: 1850-2026 | Data Visualization Watch this stunning data animation showing the complete ...
1 view
The tutorial covers important concepts such as data visualization, dashboards, and reporting using Excel. You will understand ...
1,283 views
Streamed 22 hours ago
In this video, we compare MrBeast and Stokes Twins using the latest subscriber statistics and data visualization. Watch how these ...
2 hours ago
Cole and new SWD teammate Alli talk about how to get more comfortable receiving feedback—even if you're sensitive to critique.
83 views
17 hours ago
... studio tutorial,configure auto refresh in looker studio dashboards,data visualization tutorial,looker studio reporting tutorial,how to ...
5 hours ago
Aman brings expertise in design, development, and data visualization. Vivek is an active contributor to OpenStreetMap and a ...
48 views
3 hours ago
570 views
Welcome to LeLab, the official graphical user interface (GUI) for the LeRobot library! LeLab Documentation & Install Command: ...
445 views
Get the free Data Visualization Prompt Pack:* https://clickhubspot.com/hpv4 Here's how to use Power BI for beginners and build ...
61 views
1 hour ago
#USA #China #GDP #Economics #Geopolitics #DataVisualization #IMF #WorldBank #ChinaVsUSA #BarChartRace If you enjoy ...
2 views
6 hours ago
Watch how developers go from idea to production-ready app backend using Rayfin's SDK and CLI. Generate APIs, connect data, ...
1,071 views
1 day ago
... Skills Covered ✓ Data Analytics ✓ Statistical Analysis using Excel ✓ Data Analysis using Python and R ✓ Data Visualization ...
169 views
If you've ever felt intimidated by data visualization tools, this video will show you just how fast and intuitive it actually is. We are ...
23 hours ago
What happens when your applications stop acting like dashboards and start operating like teammates? Welcome to the next era ...
139 views
Streamed 1 day ago
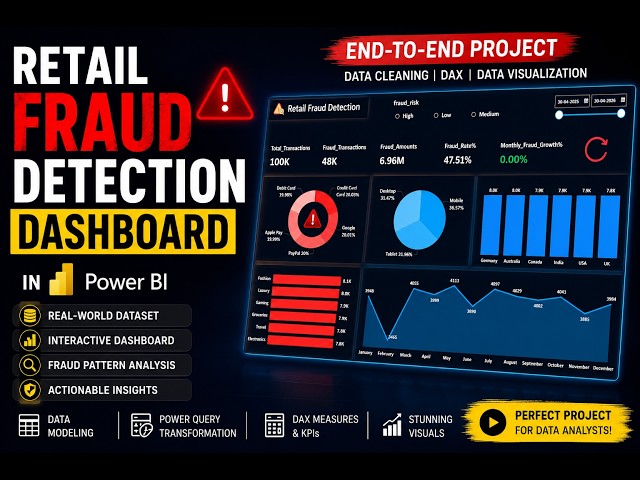
... Fraud Detection Dashboard Data Analyst Project Power BI Dashboard Power BI Tutorial DAX Power Query Data Visualization ...
21 views
Watch the dramatic timeline of the #AI market shift in this animated data visualization tracking the OpenAI vs. Anthropic revenue ...
8 views
Try Tenorshare PDNob (https://bit.ly/4woMHwA) Convert NotebookLM Slides to Editable Powerpoint and Edit Slides without ...
644 views
Episode #310! This week I sit down with Jennifer Roscoe and Shrishti Vaish, two of the key organizers behind Outlier 2026, the ...
14 views
14 hours ago
![Applied Data Science With Python Full Course 2026 [Free] | Python For Data Science | Simplilearn](/api/proxy/image?url=https%3A%2F%2Fi.ytimg.com%2Fvi%2Fd4o0DJ9XXKc%2Fsddefault.jpg)


![Gen AI Powered SQL For Busines Analytics 2026 [FREE] | Learn SQL With Generative AI | Simplilearn](/api/proxy/image?url=https%3A%2F%2Fi.ytimg.com%2Fvi%2FLPkKn4YUJTk%2Fsddefault.jpg)