Upload date
All time
Last hour
Today
This week
This month
This year
Type
All
Video
Channel
Playlist
Movie
Duration
Short (< 4 minutes)
Medium (4-20 minutes)
Long (> 20 minutes)
Sort by
Relevance
Rating
View count
Features
HD
Subtitles/CC
Creative Commons
3D
Live
4K
360°
VR180
HDR
133,736 results
In this video, I have solved an example on how to sketch the bode magnitude and phase plot. The book that I am referring to in this ...
652,575 views
9 years ago
By Ahmed Abu-Hajar, Ph.D. This is a Bode plot example to help my students in the Linear Controls course. I decided to share it ...
524,399 views
13 years ago
Visit http://ilectureonline.com for more math and science lectures! Before analyzing the Bode function for each of the 7 factors for a ...
185,919 views
6 years ago
Andrew Finelli, of UConn HKN, creates the Bode Plots for a given transfer function.
203,417 views
10 years ago
Bode plots are an essential but sometimes confusing tool for frequency domain analysis. In this video, we'll start with an intuitive ...
96,528 views
2 years ago
This video describes the benefit of being able to approximate a Bode plot by hand and explains what a Bode plot looks like for a ...
664,949 views
Bode plot exercise. Explanatory video for the subjects 6606 and 8604 "Circuit Analysis" of the Faculty of Engineering of the ...
62,603 views
5 years ago
So this was kind of the approximate form of this graph. Alright this concludes this example thank you for watching.
7,855 views
In this video, we will discuss how to draw the Bode plot from a given transfer function. This is Example 3 in this series where we ...
15,679 views
3 years ago
In this last of 5 videos, we look at an example of plotting bode plots by hand.
33,199 views
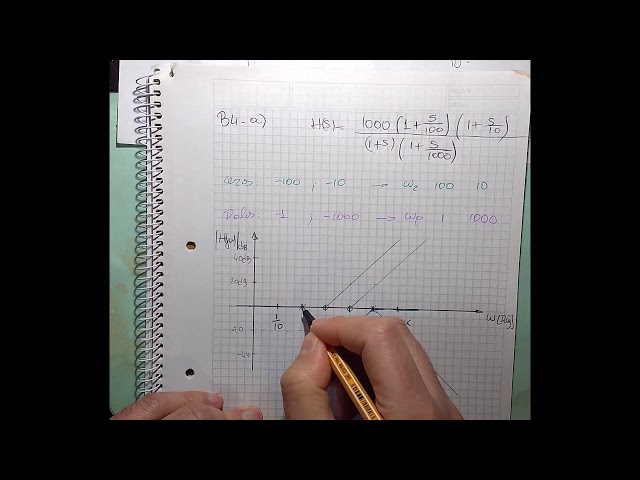
(a) Construct the Bode straight-line approximation magnitude and phase plots of H(s) using the paper-and-pencil method.
154,983 views
www.gateece.org.
57,276 views
8 years ago
Example analyzing a second order system to find the damping ratio, natural frequency and gain. Also sketches the Bode plot ...
26,935 views
... K we must recognize that the critical points of the Nyquist plot are directly proportional to the value of K for example if we double ...
131,020 views
67,619 views
... and in particular describes the Bode plot. I go through how it is generated and why we use it to visualize the frequency response ...
1,371,090 views
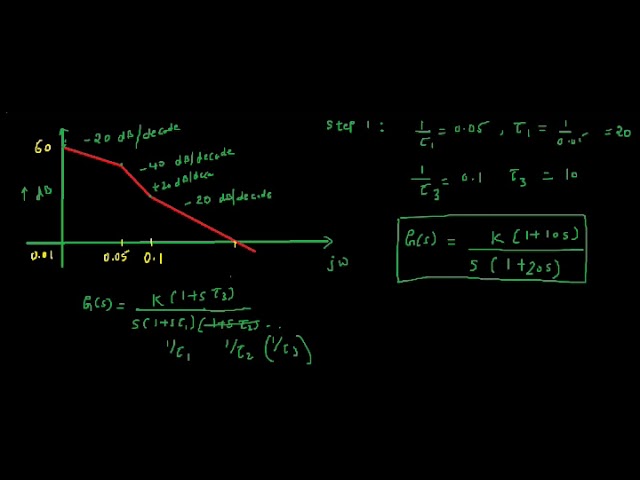
Going through how to draw the approximate bode plot for a system with one zero and two poles.
131,382 views
11 years ago
... of Electrical and Computer Engineering at the University of Utah today I wanted to go over another example of bode plots using ...
7,571 views
In this video I have sketched the magnitude Bode plot for a transfer function Phase Plot for this transfer function: ...
75,836 views
7 years ago
In this video, I have plotted the magnitude plot of a transfer function.
48,307 views
Lecture 17 Exercise 102: How to draw a Bode plot, step by step - Bode Plot playlist with more examples: ...
25,824 views
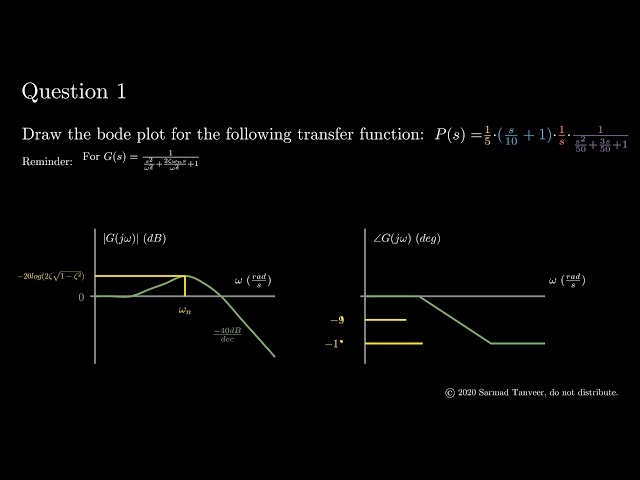
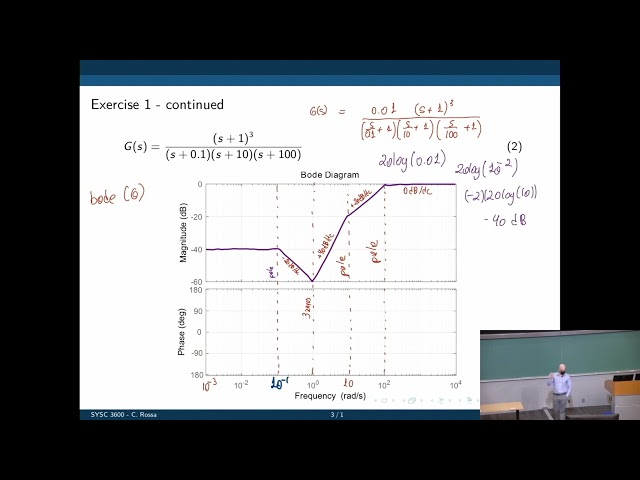
So our first question asks us to draw the bode plot for the following transfer function s plus 10 over s times s squared plus 3 s plus ...
17,487 views
Tutorial video for ECE 220 class at Mason.
405,189 views
So what is the first step if you want to do the body plot what should we do maybe we should start by preparing the transfer function ...
4,594 views
Andrew Finelli of UConn HKN introduces an important Signals and Systems topic: creating a Bode Plot given a transfer function.
13,984 views
In this video I will run through a step by step tutorial showing you how you can find the gain and phase margins using a simple ...
107,378 views
Description.
12,175 views