Upload date
All time
Last hour
Today
This week
This month
This year
Type
All
Video
Channel
Playlist
Movie
Duration
Short (< 4 minutes)
Medium (4-20 minutes)
Long (> 20 minutes)
Sort by
Relevance
Rating
View count
Features
HD
Subtitles/CC
Creative Commons
3D
Live
4K
360°
VR180
HDR
1,051 results
This data visualization video shows Top 15 Cement Producing Nations 1950–2026 For new videos, Stay connected with us: ...
3,049 views
20 hours ago
Get 20% off Mobbin Pro to help your agent design UIs that don't suck - https://mobbin.com/fireship Moonshot just released Kimi K3 ...
509,836 views
17 hours ago
Build job-ready skills by working on real-world Data Analytics projects, data visualization, dashboard creation, data cleaning, ...
1,373 views
21 hours ago
8,084 views
Streamed 18 hours ago
Europe is aging — and the map has flipped. This is the median age of 22 European countries, ranked from oldest to youngest, ...
2 views
6 hours ago
For USU's Data Visualization courses GEOG 3800 and GEOG 6220.
3 views
15 hours ago
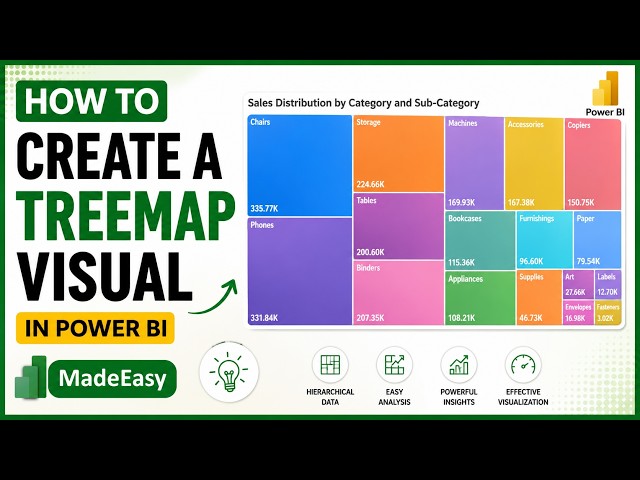
Learn how to build, format, and optimize Treemap visuals in Power BI to display hierarchical data and large distributions clearly!
0 views
37 minutes ago
... are watching this video from yeah today I'm going to explain the data visualization and dashboarding in Python using EMR data ...
Attribution: Data visualizations created using AlienArt — an interactive data storytelling platform. Explore more at: AlienArt.io ...
1 view
22 hours ago
This session demonstrates dashboard design, data visualization, business insights, DAX, data modeling, and presentation skills ...
196 views
Streamed 1 hour ago
This data visualization video shows Top 15 Largest Strawberry Producing Countries 1961–2026 For new videos, Stay connected ...
1,154 views
#ExcelInfographics #ExcelTemplates #DataVisualization 00:00 Introduction to Excel Infographics 00:11 Using Only Built-In ...
10 hours ago
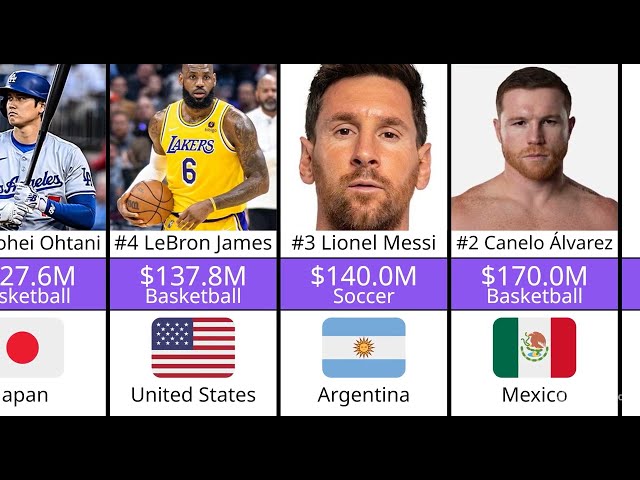
If you enjoy videos about economics, finance, GDP rankings, country comparisons, statistics, and global data visualizations, don't ...
737 views
19 hours ago
Want to learn how to implement Logistic Regression in Python? In this tutorial, we walk through a complete end-to-end machine ...
4 views
23 hours ago
Figures are approximate and intended for data visualization, not official rankings. Data sources / references:Google TrendsPublic ...
7 views
18 hours ago
#ExcelTutorial #3DPieChart #DataVisualization 00:00 Introduction to 3D Pie Charts 00:21 Prepare and Select Your Data 00:52 ...
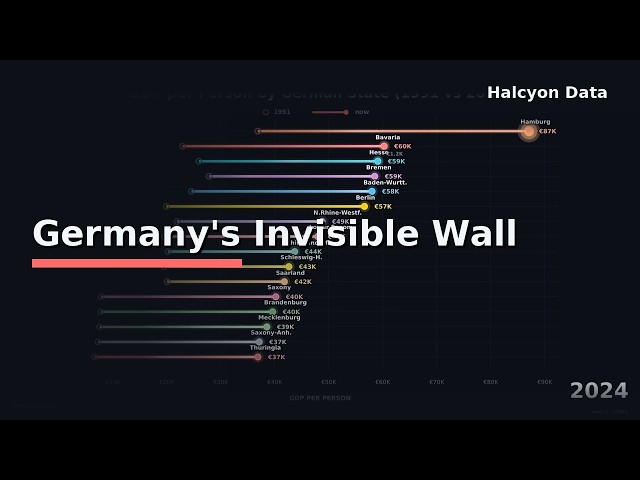
Source: VGRdL https://www.statistikportal.de/de/vgrdl #Germany #Berlin #Economy #DataVisualization #DumbbellChart.
In this tutorial, we break down the essentials of data visualization: what it is, why it is crucial for making smarter decisions, and ...
7 hours ago
DSCoV Workshop April 25, 2025 Presenter: Maxwell Krieger, Project Director, People, Place & Health Collective, Brown SPH ...
8 hours ago
#ExcelCharts #DataVisualization #ExcelTips 00:00 Introduction to Recommended Charts 00:12 Ensure Data is Tidy and Clean ...