Upload date
All time
Last hour
Today
This week
This month
This year
Type
All
Video
Channel
Playlist
Movie
Duration
Short (< 4 minutes)
Medium (4-20 minutes)
Long (> 20 minutes)
Sort by
Relevance
Rating
View count
Features
HD
Subtitles/CC
Creative Commons
3D
Live
4K
360°
VR180
HDR
452,649 results
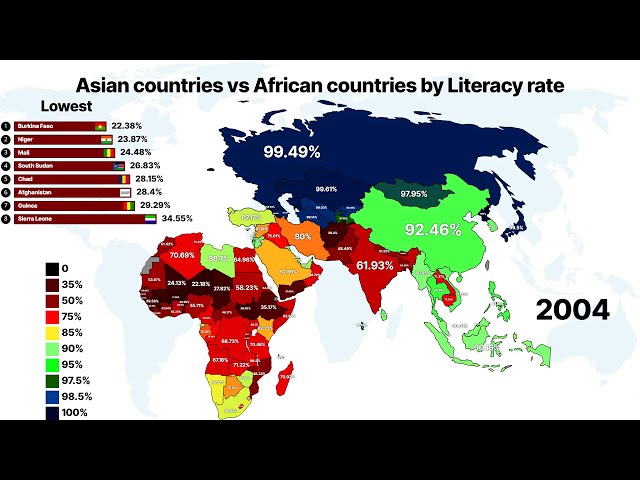
Explore the educational evolution of Asia and Africa in this comprehensive data visualization comparing literacy rates over the last ...
1,954 views
19 hours ago
... IBM Data Analysis Specialization - https://coursera.pxf.io/AoYOdR Tableau Data Visualization - https://coursera.pxf.io/MXYqaN ...
6,958 views
17 hours ago
Build job-ready skills by working on real-world Data Analytics projects, data visualization, dashboard creation, data cleaning, ...
65 views
0
Asian countries vs European countries by R&D Spending (Research and Development) | Asia vs Europe This video provides an ...
996 views
This video provides a detailed data visualization comparing infant mortality rates across Asian and European nations from 1960 to ...
15,234 views
3 days ago
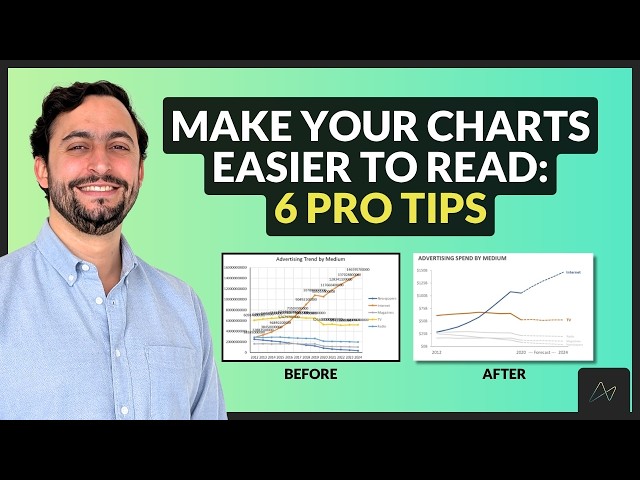
With so many chart formatting options across all the different data tools, it's important to know areas to focus on to make your ...
2,692 views
3 weeks ago
Discovering a fact is half the battle; the other half is explaining it so others can take action. In this video from NamasData ...
32 views
5 days ago
Data Visualization with the CIMA Method: Transform Clear Charts into Messages that Drive Better Executive Decisions. Discover ...
208 views
... Learning News: https://learningnews.com/ IMPROVE YOUR DATA VISUALIZATION & STORYTELLING SKILLS WORKSHOPS ...
11,374 views
Streamed 8 days ago
... country populations, geography, data visualization and real-time statistics. #WorldPopulation #PopulationLive #LiveCounter.
59 views
... Selection 01:25 | Data Access 02:16 | Jupyter Notebooks 03:43 | AI Chat 09:50 | AI Skills 11:48 | Data Visualization Tools 14:10 ...
4,948 views
1 day ago
Videocast with Kim Marriott, author of 'The Golden Age of Data Visualization: How Did We Get Here?' It's a new book in the AK ...
137 views
2 weeks ago
Transform complex data into compelling visual stories with the Advanced Data Visualization course from uCertify.
5 views
Top Data Analytics and Data Science Courses ...
3,526 views
Argentina vs England (UK)'s Population Journey: 1850-2026 | Data Visualization Watch this stunning data animation showing the ...
23 views
6 days ago
Meet Flourish Assistant, your AI-powered guide for creating beautiful, interactive data visualization projects. Get help starting ...
88 views
12 days ago
9 views
11 days ago
#GDPLive #PPP #WorldEconomy #GlobalEconomy #GDPperCapita #PurchasingPowerParity #DataVisualization #Economics ...
2 views
If you enjoy rankings, statistics, and data visualizations about the United States, consider subscribing for more videos featuring ...
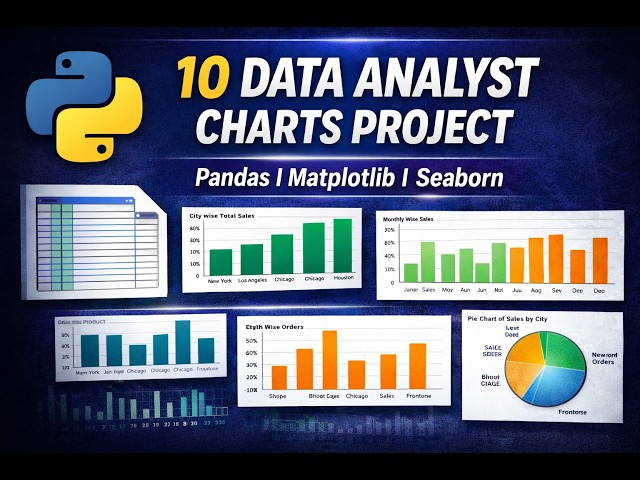
In this video, I perform Data Visualization using Python, Pandas, Matplotlib and Seaborn on a real-world sales dataset. part 1 ...
52 views
1 month ago


![Data Visualization Full Course 2026 [FREE] | Data Visualization Tutorial For Beginners | Simplilearn](/api/proxy/image?url=https%3A%2F%2Fi.ytimg.com%2Fvi%2FQPbSc_IfYTo%2Fsddefault.jpg)