Upload date
All time
Last hour
Today
This week
This month
This year
Type
All
Video
Channel
Playlist
Movie
Duration
Short (< 4 minutes)
Medium (4-20 minutes)
Long (> 20 minutes)
Sort by
Relevance
Rating
View count
Features
HD
Subtitles/CC
Creative Commons
3D
Live
4K
360°
VR180
HDR
9,801,116 results
View full lesson: http://ed.ted.com/lessons/david-mccandless-the-beauty-of-data-visualization David McCandless turns complex ...
1,591,259 views
13 years ago
Let's look at how we can implement design concepts and techniques to maximize the impact of our dashboards and reports.
91,922 views
5 years ago
Effective data visualisation comes in many shapes and sizes, but how do you move away from a standard bar chart? Watch the ...
81,526 views
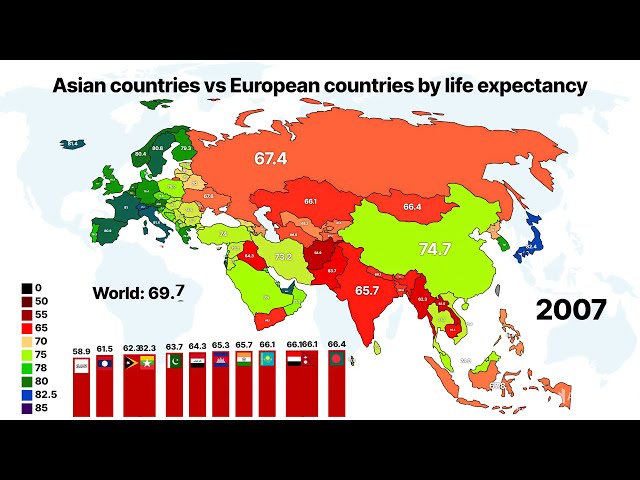
In this video, we explore the fascinating evolution of life expectancy trends across Asian and European nations from 1960 to 2026.
3,582 views
10 hours ago
Links mentioned in this video ⬇️ Exercise File ...
257,856 views
3 years ago
Bring clarity to complexity by creating an engaging data visualization piece that communicates information with ease: ...
37,299 views
4 years ago
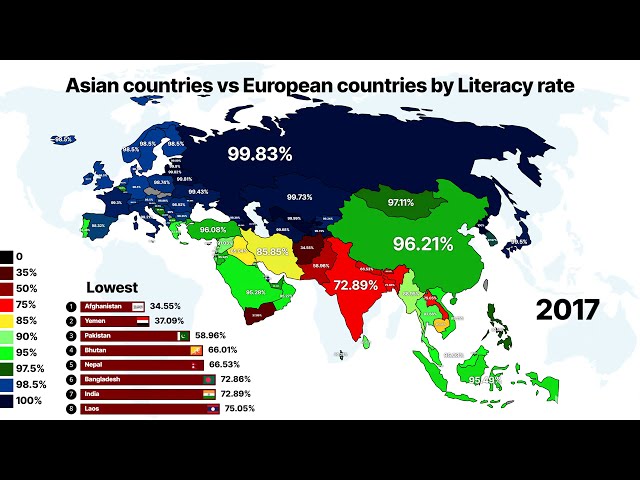
Explore the educational evolution of Asia and Europe in this comprehensive data visualization comparing literacy rates over the ...
19,808 views
2 days ago
You've probably heard the term data visualization thrown around a lot. It's why you're here, isn't it? So let's make it clear — data ...
192,002 views
Data storytelling is one of the most important skills for any data professional. Those who do it effectively can drive serious impact ...
28,082 views
1 year ago
http://www.ted.com David McCandless turns complex data sets (like worldwide military spending, media buzz, Facebook status ...
405,025 views
15 years ago
Viewers like you help make PBS (Thank you ) . Support your local PBS Member Station here: http://to.pbs.org/Donateoffbook ...
516,958 views
Join my Academy, learn Data & AI skills and land a job https://analyticsautomation.academy/ Mind map available here ...
6,205 views
8 months ago
Trustworthy Data Visualization Speaker(s): Kieran Healy Abstract: Visualizations are the most widespread, the most ...
5,545 views
Following a look at 'Sensemaking' Associate Professor Dr Kai Xu delves into some more tricks of the visualisation trade.
75,808 views
Learn Data Visualization with D3, JavaScript, and React. Part 2: https://youtu.be/H2qPeJx1RDI Created by @currankelleher .
521,495 views
Nano Banana + Gemini 3: The Data Visualization Workflow You Need | Stop Making Boring Charts – Use This Nano Banana + ...
27,285 views
7 months ago
Watch the updated version of this course: https://youtu.be/2LhoCfjm8R4 In this data visualization course, you'll learn how to ...
1,162,386 views
7 years ago
Data visualization is present in every aspect of our lives - but is it really as unbiased as it's said to be? In this SciToons video, learn ...
147,352 views
"️ IBM - Data Analyst ...
330,674 views
8 years ago
In this video we take a look at the best resources to learn Data Visualization in 2025! 25% off Analyst Builder Code: ...
17,017 views