Upload date
All time
Last hour
Today
This week
This month
This year
Type
All
Video
Channel
Playlist
Movie
Duration
Short (< 4 minutes)
Medium (4-20 minutes)
Long (> 20 minutes)
Sort by
Relevance
Rating
View count
Features
HD
Subtitles/CC
Creative Commons
3D
Live
4K
360°
VR180
HDR
9,808,039 results
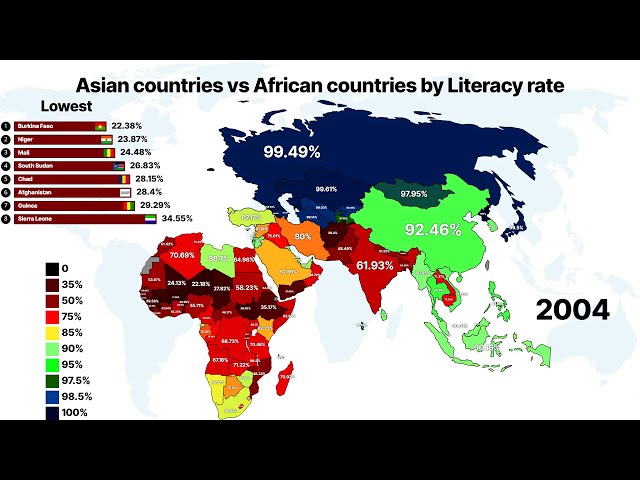
Explore the educational evolution of Asia and Africa in this comprehensive data visualization comparing literacy rates over the last ...
1,037 views
7 hours ago
View full lesson: http://ed.ted.com/lessons/david-mccandless-the-beauty-of-data-visualization David McCandless turns complex ...
1,591,104 views
13 years ago
Bring clarity to complexity by creating an engaging data visualization piece that communicates information with ease: ...
37,293 views
4 years ago
Links mentioned in this video ⬇️ Exercise File ...
257,785 views
3 years ago
Let's look at how we can implement design concepts and techniques to maximize the impact of our dashboards and reports.
91,880 views
5 years ago
You've probably heard the term data visualization thrown around a lot. It's why you're here, isn't it? So let's make it clear — data ...
191,895 views
Effective data visualisation comes in many shapes and sizes, but how do you move away from a standard bar chart? Watch the ...
81,512 views
http://www.ted.com David McCandless turns complex data sets (like worldwide military spending, media buzz, Facebook status ...
404,996 views
15 years ago
Setup, conflict, resolution. You know right away when you see an effective chart or graphic. It hits you with an immediate sense of ...
668,753 views
6 years ago
MENTORSHIP – Applications for the next cohort are open! Apply here → https://theanalyticsaccelerator.com/ We're looking for ...
66,893 views
1 year ago
12.7K subscribers
Following a look at 'Sensemaking' Associate Professor Dr Kai Xu delves into some more tricks of the visualisation trade.
75,804 views
MIT 14.310x Data Analysis for Social Scientists, Spring 2023 Instructor: Esther Duflo View the complete course: ...
104,122 views
2 years ago
Viewers like you help make PBS (Thank you ) . Support your local PBS Member Station here: http://to.pbs.org/Donateoffbook ...
516,895 views
Data storytelling is one of the most important skills for any data professional. Those who do it effectively can drive serious impact ...
28,057 views
Join my Academy, learn Data & AI skills and land a job https://analyticsautomation.academy/ Mind map available here ...
6,193 views
8 months ago
Nano Banana + Gemini 3: The Data Visualization Workflow You Need | Stop Making Boring Charts – Use This Nano Banana + ...
27,276 views
7 months ago
"️ IBM - Data Analyst ...
330,566 views
8 years ago
This comprehensive tutorial will teach you everything you need to know about Excel chart types, chart customization, and creating ...
119,900 views
Welcome to the Complete Data Visualization in Python Course! In this full video tutorial, we're diving deep into the world of ...
191,740 views