Upload date
All time
Last hour
Today
This week
This month
This year
Type
All
Video
Channel
Playlist
Movie
Duration
Short (< 4 minutes)
Medium (4-20 minutes)
Long (> 20 minutes)
Sort by
Relevance
Rating
View count
Features
HD
Subtitles/CC
Creative Commons
3D
Live
4K
360°
VR180
HDR
371 results
Learn to plot graphs in Python in this tutorial! We cover matplotlib and show you how to get an awesome looking plot. As part of ...
56,157 views
5 years ago
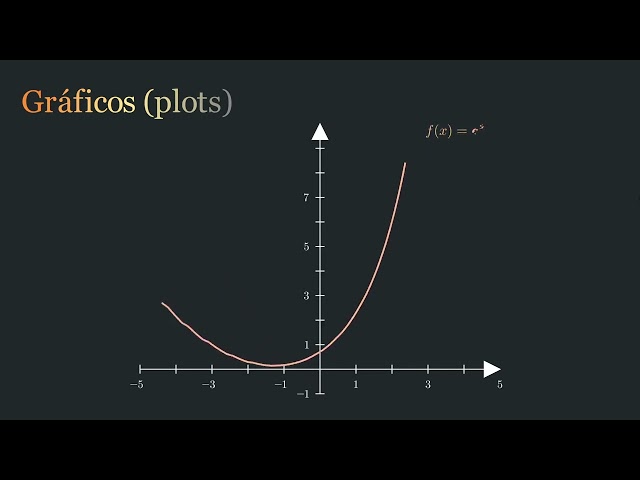
► The PYTHON package matplotlib 📊 allows you to create basic visualizations in a simple way. In this video, we'll see how to ...
81,531 views
We are highly visual creatures; we understand things better when we see them visualized. However, the step of presenting ...
69,353 views
7 years ago
Hello Everyone! Today in this video I am going to step-by-step guide you on How to install Matplotlib on Python 3.11.2 on ...
90,501 views
2 years ago
Create scatter plot with python, jupyter notebook, pandas and matplotlib using pyplot.plot What you will learn: 1. Create dataframe ...
276 views
6 years ago
Title: Introduction to Matplotlib Auto-description: This video introduces Matplotlib, focusing on the importance of data ...
934 views
3 years ago
In this video, learn how to install matplotlib on Windows. We will also install Python 3 and pip. PIP is used to install and manage ...
2,365 views
2 months ago
In this lesson, learn what is Matplotlib with its features. Matplotlib is an open-source plotting library developed by John D. Hunter.
24,407 views
To remove the axis and ticks in matplotlib plots, you can use specific functions to disable them. Here's how you can achieve this: ...
178 views
1 year ago
We have prepared a video tutorial about Matplotlib, which is a plotting library for the Python programming language and ...
657 views
4 years ago
In this video, I am going to talk about MATPLOTLIB and its usage in python. It is a very popular package used to create ...
23 views
Welcome to the "Quantum Bits" mini video series, created for the Qiskit Fall Fest 2024 and the Global Quantum Literacy Event.
28 views
In this video course, learn about Python Matplotlib and its concepts. Matplotlib is an open-source plotting library. Create interactive ...
37,744 views
Intro to Data Analysis Visualization with Python, Matplotlib and Pandas: Introduction and Overview: Time series and forecasting ...
6,340 views
Learn Data Analysis with Python in this comprehensive tutorial for beginners, with exercises included! NOTE: Check description ...
4,024,711 views
A tutorial illustrating how to generate random samples from various distributions, how to plot the samples in a histogram and how ...
1,145 views
This video shows how to install matplotlib on Python 3.13. It will walk you through, step-by-step, how to install matplotlib on Python ...
1,948 views
In this video Rob, a Kaggle Grandmaster, quickly and humorously walks through each of the popular plotting and data ...
109,118 views
When you first time plot a graph in Python Matplotlib it plots only one graph in the figure. But if you want to draw multiple plots, you ...
376 views
In this lesson, learn how to add a Matplotlib Legend in a Graph. A legend in a graph is a box on the left and right displaying the ...
3,571 views
In this lesson, learn to position legend in Matplotlib. We can easily position legends in Matplotlib using the loc parameter of the ...
2,566 views
box #programming #python In this video, it is informed that box plot is generated to assess the percentile of data distribution from ...
265 views
Textbooks: https://amzn.to/2VmpDwK https://amzn.to/2GQSV3D https://amzn.to/2SvTOQx Welcome to Engineering Python. This is ...
1,309 views
8 years ago
In this Python Matplotlib Tutorial, I will show step-by-step how to adjust the height of subplots using Matplotlib. Here I also explain, ...
652 views
Python #Matplotlib #Graph #2D_Plot #Points_Plot This video displays a way of plotting 2D points in a graph using Python and ...
1,285 views

![How to use MATPLOTLIB to make graphs 🐍💻 [Python Data Science Course in Spanish]](/api/proxy/image?url=https%3A%2F%2Fi.ytimg.com%2Fvi%2FXEG4eh5l_qU%2Fsddefault.jpg)

![How to Install Matplotlib on Python 3.11.2 on Windows 11 [ 2023 Update ] Complete Guide](/api/proxy/image?url=https%3A%2F%2Fi.ytimg.com%2Fvi%2FEmBntQAnWyc%2Fsddefault.jpg)


![How to Install Matplotlib with latest Python 3.14 on Windows 10/11 [2025 Update] Matplotlib Tutorial](/api/proxy/image?url=https%3A%2F%2Fi.ytimg.com%2Fvi%2FJqTjyPhRHMw%2Fsddefault.jpg)