Upload date
All time
Last hour
Today
This week
This month
This year
Type
All
Video
Channel
Playlist
Movie
Duration
Short (< 4 minutes)
Medium (4-20 minutes)
Long (> 20 minutes)
Sort by
Relevance
Rating
View count
Features
HD
Subtitles/CC
Creative Commons
3D
Live
4K
360°
VR180
HDR
120 results
Basta de console.log(): domina el debugger del navegador paso a paso - Programación en español ¿Cansado de llenar tu ...
2,811 views
3 months ago
If you're only using console.log(), you're missing out on some powerful features that can help you debug faster and cleaner with ...
8,357 views
2 months ago
🧠 Debug like a pro: get rid of the console.log - Programming in Spanish Does your JavaScript console look like a grocery list ...
1,046 views
Memory leaks, the silent app killer gradually slowing down performance until your application crashes unexpectedly. This video ...
6,133 views
8 months ago
Should errors be discovered at compile time or run time? False dilemma! This video demos a prototype tool which gives us the ...
374 views
3 weeks ago
As a web developer, you're no stranger to the browser and the trusty console.log in your debugging process. But did you know ...
1,297 views
11 months ago
Learn how to debug JavaScript in the browser console with these tips & tricks. From stepping through code to using Chrome Dev ...
64 views
Advanced Angular Courses - https://bit.ly/df-courses More than 45 hours of Advanced Angular content In this lesson, I will ...
32,320 views
Struggling with debugging JavaScript? In this video, I'll teach you how to debug JavaScript like a pro! Whether you're ...
37 views
Let's see how the IntelliJ IDEA debugger can help us find and fix bugs… and learn some neat tricks about the debugger in the ...
18,632 views
9 months ago
Learn how to efficiently debug Node.js applications using the powerful Visual Studio Code debugger. This tutorial covers ...
89 views
1 year ago
Streamed Live on Twitch: https://twitch.tv/tsoding Enable Subtitles for Twitch Chat More Episodes: ...
23,232 views
See the full video here: https://www.youtube.com/watch?v=EJRgwWlqGRM Greg Law from Undo addresses common ...
506 views
5 months ago
I wanted to put together an example of how to hook lldb into a zig program that is built with debug symbols. Enjoy! Join the discord ...
1,571 views
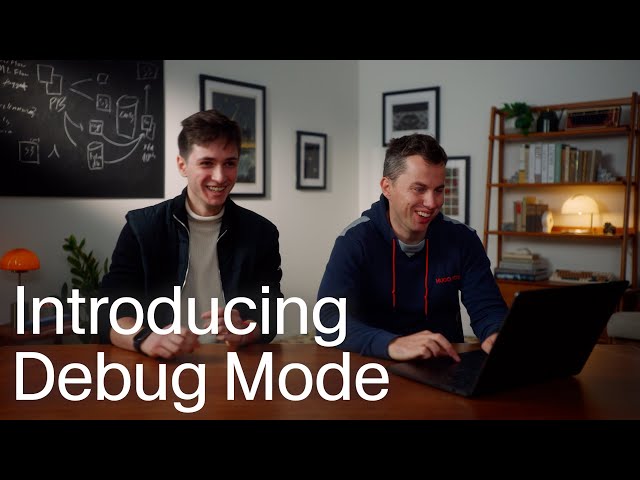
Cursor can now fix your trickiest bugs. Debug Mode instruments your code, spins up a server to capture logs, and streams runtime ...
22,515 views
35,196 views
7 months ago
Join us: Website: https://jb.gg/website Blog: https://jb.gg/blog X: https://twitter.com/intellijidea Bluesky: ...
2,220 views
1 month ago
Master JavaScript Closures with real debugging examples! In this comprehensive tutorial, we dive deep into one of JavaScript's ...
86 views
4 months ago
Streamed Live on Twitch: https://twitch.tv/tsoding Enable Subtitles for Twitch Chat Chapters: - 00:00:00 - Intro - 00:03:36 ...
24,504 views
Join Multiplayer's online webinar on May 20th, 2025, 8 PM CEST https://trymultiplayer.link/6w0n8Ry to see practical ...
524 views