Upload date
All time
Last hour
Today
This week
This month
This year
Type
All
Video
Channel
Playlist
Movie
Duration
Short (< 4 minutes)
Medium (4-20 minutes)
Long (> 20 minutes)
Sort by
Relevance
Rating
View count
Features
HD
Subtitles/CC
Creative Commons
3D
Live
4K
360°
VR180
HDR
2,668 results
Learn how to use Google Analytics 4 (GA4) to measure and understand the performance of your website. In this step-by-step ...
833 views
4 days ago
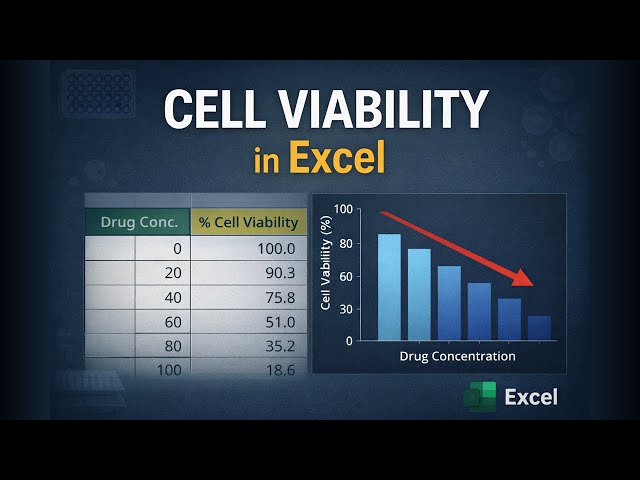
Learn how to calculate and graph percentage cell viability in Excel from raw OD (optical density) data. This step-by-step tutorial ...
44 views
7 days ago
This is going to be an embarrassing story of how I messed up over 2 million records in production, almost causing our Kubernetes ...
5,257 views
6 days ago
We will explore Mapping Tables and Data Rules, which are essential for turning raw metering data into meaningful business ...
131 views
Learn Xero the right way from the start! In this 2026 beginner-friendly tutorial, I'll walk you step-by-step through everything you ...
5,219 views
Raw Excel data shouldn't block you from creating polished slides and reports. Get 400 Of The Best Excel ...
4,726 views
5 days ago
0 views
Microsoft Excel is one of the most widely used business tools in the world. Add Copilot into Excel, and it changes how you clean ...
95 views
In this beginner-friendly tutorial, you will learn how to set up your n8n instance for free and connect it to Gmail + Google Sheets for ...
1,021 views
Stop wasting hours on manual finance reporting in Excel. In this complete step-by-step tutorial, you'll learn how to automate ...
70 views
Download the “The AI Toolkit I Use Every Week” here https://clickhubspot.com/bb2356 Google NotebookLM has always been ...
45,542 views
3 days ago
Click this link https://boot.dev/?promo=TECHWITHTIM and use my code TECHWITHTIM to get 25% off your first payment for ...
7,057 views
Data-Driven Teaching: Master clouDAS Diagnostic Analysis in HiTeach Are you tired of manually analyzing test results without ...
6 views
The Python Loops are Python function which iteratively, on a step-by-step basis, moves through a concrete or abstract program, ...
73 views
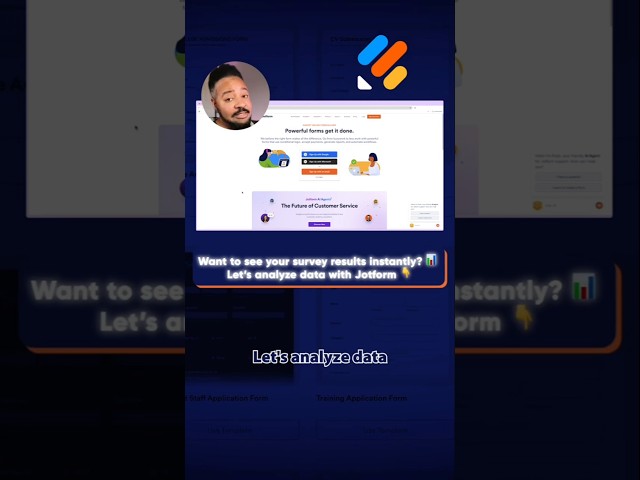
Want instant insights from your surveys? Learn how to generate and customize stunning visual reports with Jotform — in just a ...
527 views
Are your students struggling to identify the core data stories buried within lengthy research reports? In this Gemini Faculty Short ...
351 views
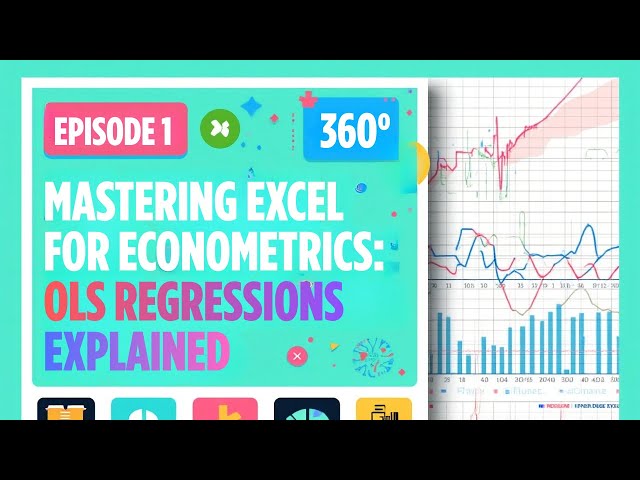
Learn how to run an OLS regression in Excel step‑by‑step. This tutorial covers selecting your data, enabling and running the ...
2 views
Hi, I'm Jun Cowan of StructuralGeoloy.com. In this video, I ask a question that many geologists, and plenty of software vendors, ...
359 views
This video presents how to generate a real time prediction, how to monitor prediction results, and how to set up a notification in ...
31 views
Standard fields like phone numbers and email addresses are a great start, but to make your CRM truly reflect your unique ...
69 views