Upload date
All time
Last hour
Today
This week
This month
This year
Type
All
Video
Channel
Playlist
Movie
Duration
Short (< 4 minutes)
Medium (4-20 minutes)
Long (> 20 minutes)
Sort by
Relevance
Rating
View count
Features
HD
Subtitles/CC
Creative Commons
3D
Live
4K
360°
VR180
HDR
371 results
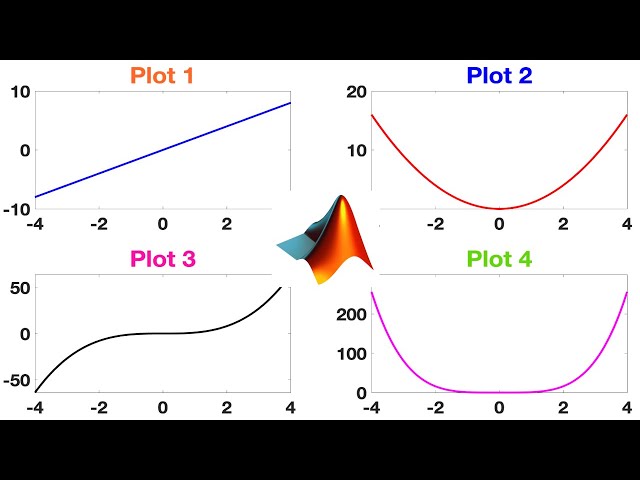
Welcome to Laplace Academy In this tutorial I draw multiple plot in a single figure. One of doing this is by using subplot command.
1,965 views
3 years ago
Combine your plots into one window and impress all your friends!
4,909 views
2 years ago
Subplot #Matlab for Subplot -~-~~-~~~-~~-~- Please watch: "#oliveoil #fishoil #omega3" ...
52 views
4 years ago
Get The Complete MATLAB Course Bundle for 1 on 1 help! https://josephdelgadillo.com/product/matlab-course-bundle/ Enroll in ...
8,063 views
9 years ago
In this video tutorial, we generate a subplot with three rows and two columns in Matlab or Octave. We also discuss adding axes ...
278 views
Remember to subscribe to the channel add likes to videos Leave your question in the comments.
225 views
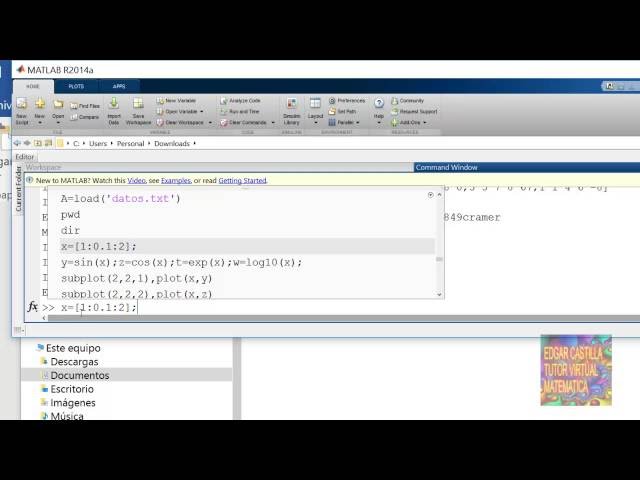
PRESENTACIÓN DE UN VÍDEO EN EL CUAL SE MUESTRA EL USO DE SUBPLOT EN MATLAB 2016.
84 views
Learn how to create MATLAB plots interactively. If you know exactly how you want to visualize your data, simply select/highlight it ...
6,132 views
1 year ago
With the interactive Model Analyzer app, you can easily visualize experimental data and simulation results. In this video, you will ...
1,608 views
5 years ago
What does subplot mean? A spoken definition of subplot. Intro Sound: Typewriter - Tamskp Licensed under CC:BA 3.0 Outro ...
323 views
10 years ago
How to Make Subplots in MATLAB using Tiledlayout and subplot Learn how to create multiple plots in MATLAB using two simple ...
153 views
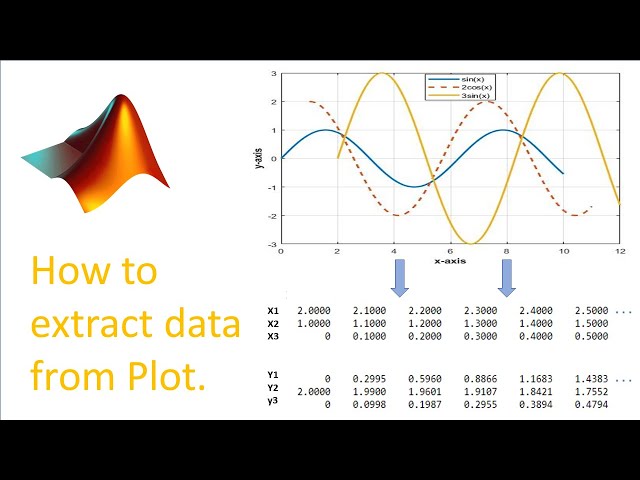
In this video, we going to see how we extract data from plotted figures. This video includes: Getting the data point from two plotted ...
17,667 views
0:00 Intro 0:26 Overview 0:49 Single data set Commands covered: plot, title, xlabel, ylabel, grid 6:05 Interpret plots 6:29 Summary: ...
21,383 views
Learn how to create and interact with plots in MATLAB®, which is an important part of creating MATLAB code. Anyone – from ...
44,947 views
6 years ago
hello everyone today we're going to discuss MATLAB graphics. so matlab is a powerful tool in visualizing equations statistical ...
165 views
In this Python Matplotlib Tutorial, I will show step-by-step how to adjust the height of subplots using Matplotlib. Here I also explain, ...
649 views
http://www.ltu.edu/engineering/mechanical/index.asp Review of Matlab basics. Creating variables and arrays, matrix vs. array ...
2,774 views
12 years ago
MATLAB Plotting | Lecture 01 | MATLAB Advanced | R2018a This video gives details about the various plotting operations in ...
312 views
Welcome to Laplace Academy. In this tutorial we're going to discuss 2D plotting in MATLAB. The main command that we are ...
706 views
MATLAB Tutorial 3 Prof. Abhijit Sarkar Department Of Mechanical Engineering IIT Madras Topics covered in this tutorial: Various ...
1,514 views
8 years ago
How to produce 2-D and 3-D plots in Matlab? The basics. Software: Matlab Version: 2017a. Topics: 1:02 Data generation 5:00 ...
698 views
Organized by textbook: https://learncheme.com/ Describes how to use MATLAB to graph equations and experimental data.
5,187 views
13 years ago
When you first time plot a graph in Python Matplotlib it plots only one graph in the figure. But if you want to draw multiple plots, you ...
375 views
This introduction to MATLAB covers work areas as seen when first opening the program. It steps through writing basic equations ...
1,108 views
Welcome to Laplace Academy Let's get familiar with these 10 commands to plot in a special way. Mostly, programmers use line ...
635 views