Upload date
All time
Last hour
Today
This week
This month
This year
Type
All
Video
Channel
Playlist
Movie
Duration
Short (< 4 minutes)
Medium (4-20 minutes)
Long (> 20 minutes)
Sort by
Relevance
Rating
View count
Features
HD
Subtitles/CC
Creative Commons
3D
Live
4K
360°
VR180
HDR
251 results
In this Python Matplotlib Tutorial, I will show step-by-step how to adjust the height of subplots using Matplotlib. Here I also explain, ...
647 views
3 years ago
When you first time plot a graph in Python Matplotlib it plots only one graph in the figure. But if you want to draw multiple plots, you ...
375 views
Master AI from Zero to Advanced: https://ailearninghub.io ------------------------- In this video, you'll learn how to create and customize ...
86 views
7 months ago
How To Create Subplots using Matplotlib | How To Create Subplots using Python In this Matplotlib subplots tutorial, you'll master ...
46 views
2 years ago
An introduction to Matplotlib and Seaborn, two key libraries for plotting data in Python. We also introduce the notion of EDA, ...
408 views
4 years ago
Master AI & LLMs – Fine-Tuning, RAG, DeepSeek, OpenAI & More! https://srpai.co/ Join my Udemy course for just ₹399/9$ ...
3 views
8 months ago
MIT 6.100L Introduction to CS and Programming using Python, Fall 2022 Instructor: Ana Bell View the complete course: ...
24,284 views
1 year ago
Based on the Matplotlib for HEP workshop developed by HSF Training, we will present a short introduction to matplotlib and ...
61 views
You can find the slides and notebook on my GitHub repository for the course: https://github.com/PJalgotrader/ML-USU-SP21 Here ...
1,289 views
Ever been captivated by a 3D plot and thought, 'How can I create that?' In this tutorial, we take you on a journey to master ...
400 views
... subplot height using Matplotlib https://youtu.be/x4oO4ewluzY How to plot Subplot in Matplotlib https://youtu.be/kv7rxP9iQTI How ...
487 views
DATA TALK EP 4 DATA VISUALIZATION AND MATPLOTLIB #DATA #TALK #EP #4 #DATA #VISUALIZATION #AND ...
43 views
Textbooks: https://amzn.to/2VmpDwK https://amzn.to/2GQSV3D https://amzn.to/2SvTOQx Welcome to Engineering Python. This is ...
6,389 views
8 years ago
In this lesson, learn to plot titles and position them in Matplotlib. To set the titles in a graph, use the title() function in Matplotlib.
3,297 views
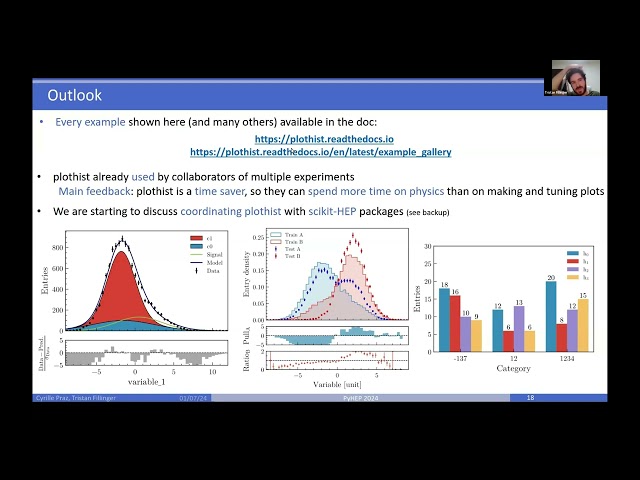
Plothist is a Python package that provides easy-to-use functions for visualizing and comparing histograms generated with ...
102 views
Same Data, Different Tools: Visualizing with R and Python Speaker(s): Olivia Hebner Abstract: In 2024, our team participated ...
565 views
2 months ago
IDRE Workshop from April 16, 2021 Materials available here: https://github.com/benjum/idre-spring21-python-data-viz-1.
1,026 views
Title: Matplotlib: Figure Initialization: Size Auto-description: This video explains the procedure for initializing a figure ...
745 views
A tutorial illustrating how to generate random samples from various distributions, how to plot the samples in a histogram and how ...
1,140 views
390 views


![[Part 3] Plotting data with Python](/api/proxy/image?url=https%3A%2F%2Fi.ytimg.com%2Fvi%2FSQgrAdeZcLg%2Fsddefault.jpg)