Upload date
All time
Last hour
Today
This week
This month
This year
Type
All
Video
Channel
Playlist
Movie
Duration
Short (< 4 minutes)
Medium (4-20 minutes)
Long (> 20 minutes)
Sort by
Relevance
Rating
View count
Features
HD
Subtitles/CC
Creative Commons
3D
Live
4K
360°
VR180
HDR
733 results
To try everything Brilliant has to offer—free—for a full 30 days, visit https://brilliant.org/ArtemKirsanov/ The first 200 of you will get ...
919,552 views
2y ago
A behind-the-scenes look at how I animate videos. Code for all the videos: https://github.com/3b1b/videos Manim: ...
3,130,399 views
1y ago
A bar chart race, also known as a bar chart animation or a bar chart race animation, is a data visualization technique that shows ...
6,409 views
3y ago
Python tkinter animation animations canvas tkinter GUI tutorial #Python #tkinter #animation #animations #canvas #GUI #tutorial.
61,850 views
5y ago
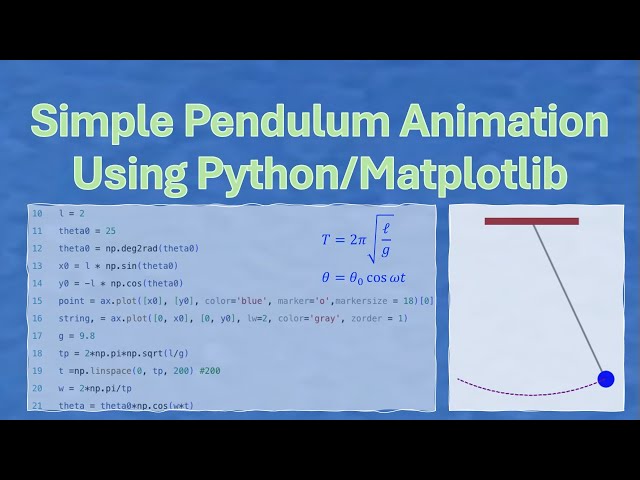
In this video, you will learn how to write a python program to do the animation of a simple pendulum. Step by step instructions are ...
48 views
5mo ago
How to make animated plot (animated chart) with Matplotlib and Python programming Language. In this tutorial, an animated plot ...
25,021 views
4y ago
Source code: https://gist.github.com/syphh/9fa861563977e2cbbf4ddea518677b0a Learn graph theory algorithms: ...
1,229 views
In this video, we will visualize the sine and cosine waves using Python's Matplotlib library. The video showcases a dynamic ...
899 views
To learn for free on Brilliant, go to https://brilliant.org/techwithtim . Brilliant's also given our viewers 20% off an annual Premium ...
35,942 views
... um you can see that i'm importing uh matplotlib already uh from matplotlib.animation i'm importing funk animation uh and then ...
281 views
In this Matplotlib animation, I demonstrate the order in which splits are made based on the information gain while constructing a ...
1,885 views
7y ago
This program simulates inertia and surface tension. I made this program in the early 2000s, it was a java applet. I made this ...
58 views
In this video, we learn how to plot a scatter plot in Python programming language from scratch in matplotlib package. ➤ One of the ...
568 views
Speaker: Reshama Shaikh Plotly is a versatile, open-source python graphing library which lets us make interactive graphs.
108 views
Master Python through Creative Projects! Learn to Build Cool Apps with Step-by-Step Tutorials! Welcome to the ultimate Python ...
10 views
11mo ago
Matplotlib is used to customize visuals and create animation and Seaborn is used to create exploratory charts like Heat map ...
872 views
Python tkinter animation animate multiple objects tutorial for beginners #Python #tkinter #animation #animate #multiple #objects ...
44,013 views