ViewTube

ViewTube
Sign inSign upSubscriptions
Filters

Upload date

Type

Duration

Sort by

Features

Reset

229 results

IFE - TU Graz
Analog Filters - Higher Order Filters, Cascading Passive Filters, Filters with Inductances, AM Radio

Advantages and problems of higher-order filters are explained by the Bode diagram and the phasor diagram. In addition we ...

20:27
Analog Filters - Higher Order Filters, Cascading Passive Filters, Filters with Inductances, AM Radio

8,346 views

4 years ago

Hari Mohan Rai
Basic Steps to draw polar plot-1

This video explains about the basic steps to draw polar plot of type zero system. The polar plot is a topic of control system ...

10:00
Basic Steps to draw polar plot-1

12,151 views

9 years ago

Wisc-Online
Transfer Functions: RL High Pass Filter

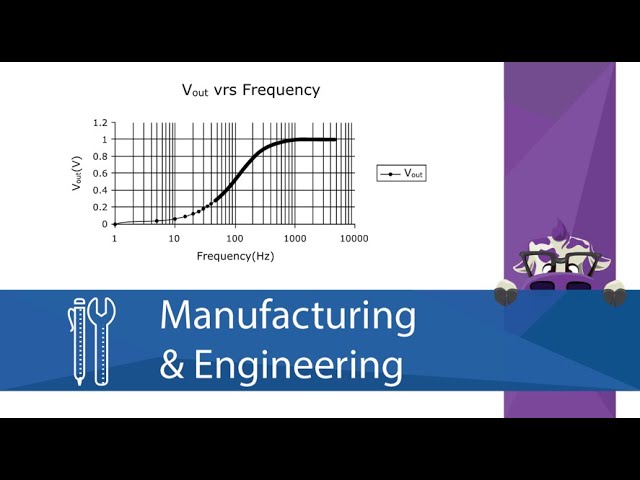
The circuit is also simulated in Electronic WorkBench and the resulting Bode plot is compared to the graph from Excel. Thanks for ...

1:45
Transfer Functions: RL High Pass Filter

2,314 views

4 years ago

Jim Fowler
What is a phase plot? - Complex Analysis

We can use "phase plots" to visualize functions f : ℂ → ℂ. Thanks to @rreusser for the phase plotting code at ...

6:42
What is a phase plot? - Complex Analysis

2,514 views

5 years ago

A
How to increase size of y x axis, Title, X/Y Labels of Bode Diagram or Step Response in Matlab

For set the Font and Size of Title, X/Ylabel, and Numbers of Bode Diagram or Step Response; in Command Window of MATLAB ...

5:36
How to increase size of y x axis, Title, X/Y Labels of Bode Diagram or Step Response in Matlab

1,777 views

5 years ago

Mark Newman
Where are magnitude and phase in the output of the FFT?

The output of the FFT is just a list of complex numbers. But, we are used to seeing the FFT of a signal represented as a graph of ...

10:34
Where are magnitude and phase in the output of the FFT?

28,646 views

3 years ago

Dr Mehrdad Arashpour
Line of Balance 2026 📈 Location based Management System📈 Project workflow 📈 Linear Scheduling Method

I use iPhone 17 pro max→ https://amzn.to/3Vr1BB6 In this video of #engineeringmanagementacademy ...

5:48
Line of Balance 2026 📈 Location based Management System📈 Project workflow 📈 Linear Scheduling Method

2,891 views

1 year ago

Dr Mehrdad Arashpour
Pareto Front Optimization in EXCEL (3 Minutes!!) ✅ RISK Mitigation Strategies in Project Management

I use Insta360: https://amzn.to/4mvNoxZ In this video of #engineeringmanagementacademy #Paretofront is tutored for ...

3:57
Pareto Front Optimization in EXCEL (3 Minutes!!) ✅ RISK Mitigation Strategies in Project Management

2,813 views

1 year ago

Building Intuition
State Space Control - Negative Feedback

Typo at 7:45, should have been Y(s)/U(s)

9:23
State Space Control - Negative Feedback

659 views

7 years ago

Nigel Francis (Dr Nigel Francis)
How to calculate Vmax and Km from a Lineweaver-Burk plot

A step by step guide for calculating Vmax and Km from a Lineweaver-Burk plot in Excel.

8:35
How to calculate Vmax and Km from a Lineweaver-Burk plot

107,926 views

6 years ago

nptelhrd
Mod-03 Lec-36 LCL filter design

Power Electronics and Distributed Generation by Dr. Vinod John,Department of Electrical Engineering,IISc Bangalore.For more ...

57:02
Mod-03 Lec-36 LCL filter design

22,819 views

11 years ago

IFE - TU Graz
Analog-to-Digital Converters (ADC) - Flash ADC and Successive Approximation Register ADC

This Tutorial describes two basic implementations of analog to digital converters, the flash converter and the successive ...

14:37
Analog-to-Digital Converters (ADC) - Flash ADC and Successive Approximation Register ADC

9,299 views

4 years ago

NPTEL IIT Bombay
Lecture 82 : Tutorial on V-n Diagram of Transport Aircraft

Lecture 82 : Tutorial on V-n Diagram of Transport Aircraft.

33:27
Lecture 82 : Tutorial on V-n Diagram of Transport Aircraft

29,743 views

5 years ago

NPTEL IIT Bombay
Week 2-Lecture 5 : Ellingham Diagram

Ellingham Diagram To access the translated content: 1. The translated content of this course is available in regional languages.

31:50
Week 2-Lecture 5 : Ellingham Diagram

14,644 views

6 years ago

Wisc-Online
Ziegler-Nichols Reaction Curve Process Identification Procedure

Learners follow the steps required to perform the Ziegler-Nichols reaction curve process identification procedure. Thanks for ...

8:27
Ziegler-Nichols Reaction Curve Process Identification Procedure

4,149 views

5 years ago

Statistics Made Easy
Statistics Made Easy 6.2: Testing Moderation in Stata

In this tutorial, we implement a moderation analysis in Stata. We use interaction terms and interpret and visualize the marginal ...

19:55
Statistics Made Easy 6.2: Testing Moderation in Stata

4,022 views

1 year ago

NPTEL IIT Bombay
#41 Second Order Systems | Romeo & Juliet Model | Introduction to System Dynamics Modeling

Welcome to 'Introduction to System Dynamics Modeling' course ! This lecture takes a unique and engaging approach to ...

19:03
#41 Second Order Systems | Romeo & Juliet Model | Introduction to System Dynamics Modeling

962 views

6 years ago

KhanAcademyTurkce
Orantılı İlişkilerin Grafiğini Denklem Kurarak Çizme (Oran - Orantı) (Matematik)

Daha fazlası için: http://www.khanacademy.org.tr Matematikten sanat tarihine, ekonomiden fen bilimlerine, basit toplamadan ...

3:31
Orantılı İlişkilerin Grafiğini Denklem Kurarak Çizme (Oran - Orantı) (Matematik)

340 views

12 years ago

wikipedia tts
Cauchy argument principle | Wikipedia audio article

This is an audio version of the Wikipedia Article: https://en.wikipedia.org/wiki/Argument_principle 00:03:01 1 Interpretation of the ...

20:21
Cauchy argument principle | Wikipedia audio article

91 views

7 years ago