ViewTube

ViewTube
Sign inSign upSubscriptions
Filters

Upload date

Type

Duration

Sort by

Features

Reset

129 results

NPTEL IIT Bombay
Tutorial 04 Part 01: Plotting In 1 D Using Python

Week 4: Tutorial 04 Part 01: Plotting In 1 D Using Python.

28:22
Tutorial 04 Part 01: Plotting In 1 D Using Python

1,173 views

3 years ago

Spoken-Tutorial IIT Bombay
Using the plot command interactively - Hindi

Using the plot command interactively ipython -pylab pylab brings in the libraries necessary for Scientific Computing. linspace, len ...

9:25
Using the plot command interactively - Hindi

1,743 views

11 years ago

COMPUTER & EXCEL SOLUTION
function in python in hindi with full explanation@COMPUTEREXCELSOLUTION #python #function

Join this channel to get access to perks: https://www.youtube.com/channel/UC4C_tfy6WLDxzVVO3y6YinA/join This is my ...

9:14
function in python in hindi with full explanation@COMPUTEREXCELSOLUTION #python #function

27 views

1 year ago

COMPUTER & EXCEL SOLUTION
Create a function to find prime number in python in hindi@COMPUTEREXCELSOLUTION

Join this channel to get access to perks: https://www.youtube.com/channel/UC4C_tfy6WLDxzVVO3y6YinA/join This is my ...

0:51
Create a function to find prime number in python in hindi@COMPUTEREXCELSOLUTION

67 views

2 years ago

Spoken-Tutorial IIT Bombay
Multiple plots - Hindi

Multiple plots overlays linspace give one with very few points, more points show smoothness of the curve legend figure 1, figure2 ...

20:29
Multiple plots - Hindi

655 views

11 years ago

Spoken-Tutorial IIT Bombay
Saving plots - Hindi

Saving plots basic savefig png, pdf, ps, eps, svg going to OS and looking at the file.

5:47
Saving plots - Hindi

1,125 views

11 years ago

Tyler Caraza-Harter
CS 320 Nov 2 (Part 1) - Shapely Venn Diagram

... towards my ultimate goal of making the venn diagram i need to somehow get these on a matplotlib area and so you can see i've ...

24:31
CS 320 Nov 2 (Part 1) - Shapely Venn Diagram

451 views

5 years ago

freeCodeCamp.org
Python for Everybody - Full University Python Course

This Python 3 tutorial course aims to teach everyone the basics of programming computers using Python. The course has no ...

13:40:10
Python for Everybody - Full University Python Course

7,573,443 views

6 years ago

New Mexico EPSCoR
Python Fundamentals with Data Analysis and Visualization

Python is a high-level programming language that is leveraged in a wide range of disciplines and fields. This webinar training ...

47:21
Python Fundamentals with Data Analysis and Visualization

139 views

4 years ago

DataScienceIB
Python Programming Tutorial for SAS Data Analysis 3/3

This video is the last of three parts of a programming tutorial on using Python for data analysis of small-angle scattering ...

43:00
Python Programming Tutorial for SAS Data Analysis 3/3

74 views

3 years ago

Spoken-Tutorial IIT Bombay
Other types of plots - Hindi

प्लॉट्स के अन्य प्रकार scatter pie chart bar chart log illustration of other plots, matplotlib help.

13:36
Other types of plots - Hindi

330 views

11 years ago

COMPUTER & EXCEL SOLUTION
Text to columns in Google sheet@COMPUTEREXCELSOLUTION

This is my Technology Related information.Like "O" Level,"CCC", "Webdesign", "C" language, "C++" "Php","Java","Java Script", ...

0:59
Text to columns in Google sheet@COMPUTEREXCELSOLUTION

215 views

4 years ago

Spoken-Tutorial IIT Bombay
Using the plot command interactively - Punjabi

Using the plot command interactively ipython -pylab pylab brings in the libraries necessary for Scientific Computing. linspace, len ...

9:26
Using the plot command interactively - Punjabi

50 views

11 years ago

Spoken-Tutorial IIT Bombay
Getting started with strings - Hindi

Getting started with strings strings single, double, triple quoted accessing elements show immutability tell that there are methods ...

11:30
Getting started with strings - Hindi

338 views

11 years ago

Tyler Caraza-Harter
CS 320 Nov 9 (Part 1) - Vector Multiplication

... math classes we'll talk about it as one-dimensional and then we'll say which angle it goes um in python and numpy in particular ...

22:33
CS 320 Nov 9 (Part 1) - Vector Multiplication

235 views

5 years ago

Spoken-Tutorial IIT Bombay
Saving plots - English

Saving plots basic savefig png, pdf, ps, eps, svg going to OS and looking at the file.

5:42
Saving plots - English

5,423 views

11 years ago

Spoken-Tutorial IIT Bombay
Plotting the data - Hindi

डेटा प्लॉट करना, स्क्वायर फंक्शन का उपयोग करके L vs. T2 प्लॉट करना, 3cols के ...

8:28
Plotting the data - Hindi

371 views

11 years ago

NPTEL IIT Bombay
Lecture 15:  Regression

Lecture 15: Regression.

32:31
Lecture 15: Regression

8,239 views

6 years ago

Spoken-Tutorial IIT Bombay
Using python modules - Hindi

पाइथन मॉड्यूल्स उपयोग करना scipy pylab sys.

12:19
Using python modules - Hindi

1,916 views

11 years ago

Spoken-Tutorial IIT Bombay
Plotting the data - English

Plotting the data plot L vs. T2 using square function problem with 3 cols 3rd column is error error bar.

8:28
Plotting the data - English

2,325 views

11 years ago

Spoken-Tutorial IIT Bombay
Embellishing a plot - English

Embellishing a plot Title Label line width, color, style annotations.

15:16
Embellishing a plot - English

6,951 views

11 years ago

BocoupLLC
Vega Lite: A Grammar of Interactive Graphics - Wongsuphasawat, Moritz, and Satyanarayan

To perform interactive analysis in Python, you can use a library led by Brian Granger. And we can create this histogram that we ...

30:07
Vega Lite: A Grammar of Interactive Graphics - Wongsuphasawat, Moritz, and Satyanarayan

34,514 views

8 years ago

Spoken-Tutorial IIT Bombay
Additional features of IPython - Hindi

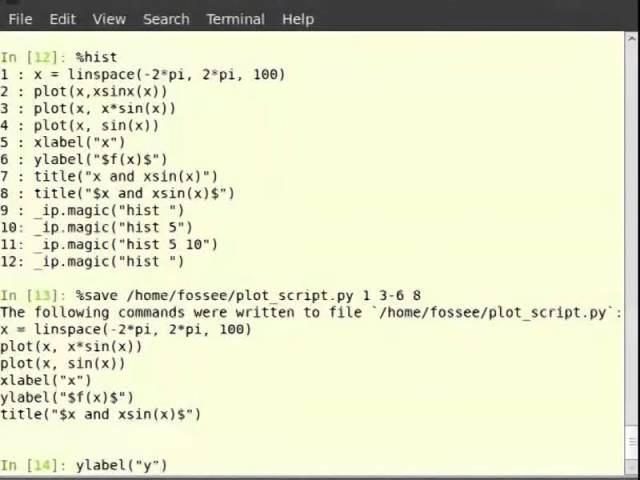
आईपाइथन की अतिरिक्त विशेषताएँ ave, %history, %run.

12:21
Additional features of IPython - Hindi

534 views

11 years ago

Spoken-Tutorial IIT Bombay
Using the plot command interactively - Telugu

Using the plot command interactively ipython -pylab pylab brings in the libraries necessary for Scientific Computing. linspace, len ...

9:27
Using the plot command interactively - Telugu

4,522 views

11 years ago

Spoken-Tutorial IIT Bombay
Other types of plots - English

Other types of plots scatter pie chart bar chart log illustration of other plots, matplotlib help.

13:37
Other types of plots - English

2,323 views

11 years ago