Upload date
All time
Last hour
Today
This week
This month
This year
Type
All
Video
Channel
Playlist
Movie
Duration
Short (< 4 minutes)
Medium (4-20 minutes)
Long (> 20 minutes)
Sort by
Relevance
Rating
View count
Features
HD
Subtitles/CC
Creative Commons
3D
Live
4K
360°
VR180
HDR
809 results
A behind-the-scenes look at how I animate videos. Code for all the videos: https://github.com/3b1b/videos Manim: ...
2,728,635 views
1 year ago
To try everything Brilliant has to offer—free—for a full 30 days, visit https://brilliant.org/ArtemKirsanov/ The first 200 of you will get ...
896,885 views
2 years ago
How to make animated plot (animated chart) with Matplotlib and Python programming Language. In this tutorial, an animated plot ...
24,745 views
4 years ago
Animate your python graphs to bring insights using the library Pillow. #python #graphicdesign #animation.
2,860 views
3 years ago
A bar chart race, also known as a bar chart animation or a bar chart race animation, is a data visualization technique that shows ...
6,149 views
In this video Rob, a Kaggle Grandmaster, quickly and humorously walks through each of the popular plotting and data ...
108,562 views
Amazing tree animation python|python full animation course #pythonturtle #python#animation #ytshorts #pythonprogramming ...
1,741 views
11 months ago
Source code: https://gist.github.com/syphh/9fa861563977e2cbbf4ddea518677b0a Learn graph theory algorithms: ...
1,219 views
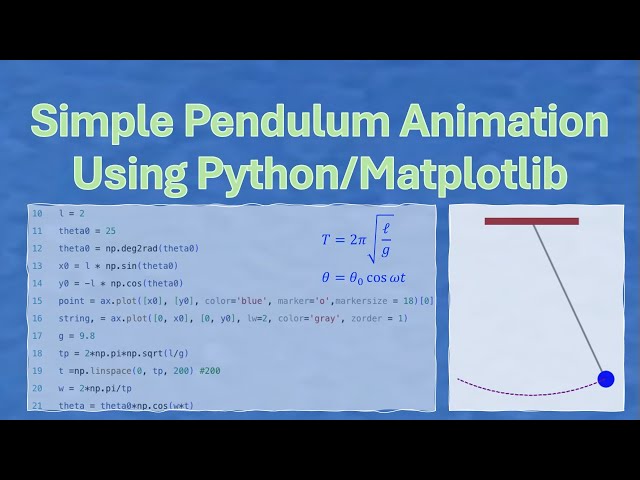
In this video, you will learn how to write a python program to do the animation of a simple pendulum. Step by step instructions are ...
14 views
5 days ago
Go experience the explorable videos: https://eater.net/quaternions Ben Eater's channel: https://www.youtube.com/user/eaterbc ...
1,451,045 views
7 years ago
In the ever-evolving world of data visualization, scatterplot animation has emerged as a captivating and powerful tool to breathe ...
176 views
Looking for a way to elevate your plot presentation? Learn how to record and animate plots in MATLAB with this quick tutorial on ...
12,897 views
This program simulates inertia and surface tension. I made this program in the early 2000s, it was a java applet. I made this ...
58 views
Most of us have heard the saying, "A picture is worth a thousand words," but a movie builds context and a story, especially when ...
1,286 views
In this video, we are going to learn about how to create a responsive bar chart animations in 3 lines of code using our favourite ...
727 views
This program simulates inertia and surface tension. I made this program in the early 2000s, it was a java applet. I made a 1D ...
72 views
In this Matplotlib animation, I demonstrate the order in which splits are made based on the information gain while constructing a ...
1,861 views
6 years ago
This video is part of an online course, Interactive 3D Graphics. Check out the course here: https://www.udacity.com/course/cs291.
299 views
10 years ago
When uploading a plot to a platform like Twitter or Slack, users who view the file when they are in dark mode will likely not be able ...
361 views
In this simple demo, I have used Matplotlib to create a mp4 file which shows how gradient descent is used to come up with the ...
3,052 views
In the field of astronomy and astrophysics, data cubes are fundamental tools for analyzing three-dimensional data sets that ...
255 views
Speaker: Reshama Shaikh Plotly is a versatile, open-source python graphing library which lets us make interactive graphs.
106 views
Python animation with source code python full course #pythonturtle #tutorial #python #sourcecode #ytshorts #viralshorts ...
399 views
A data cube in astronomy is a three-dimensional array of data, where two of the dimensions correspond to spatial information (like ...
390 views
Let's try to convince a bunch of particles to behave (at least somewhat) like water. Written in C# and HLSL, and running inside the ...
2,449,684 views