ViewTube

ViewTube
Sign inSign upSubscriptions
Filters

Upload date

Type

Duration

Sort by

Features

Reset

601 results

Jakubication
How To Install matplotlib in Python 3.14.6

This video shows how to install matplotlib on Python 3.14.6 It will walk you through, step-by-step, how to install matplotlib on ...

2:43
How To Install matplotlib in Python 3.14.6

1 view

7 hours ago

Simplilearn
Applied Data Science With Python Full Course 2026 [Free] | Python For Data Science | Simplilearn

Data Scientist Masters Program (Discount - YTBE15) ...

7:36:29
Applied Data Science With Python Full Course 2026 [Free] | Python For Data Science | Simplilearn

1,343 views

Streamed 1 day ago

yesh
Matplotlib Pyplot Tutorials - Python and Data Science Visualization
54:53
Matplotlib Pyplot Tutorials - Python and Data Science Visualization

7 views

6 days ago

하얀설표
V.3 Seolpyo MPLchart(python fast candlestick chart)

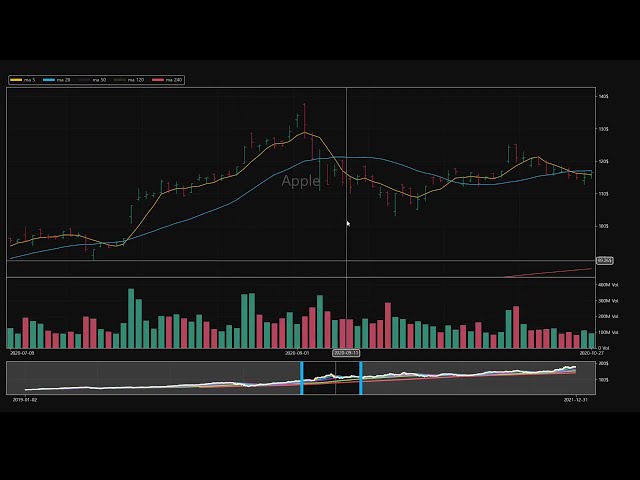
python matplotlib + tkinter candlestick chart version 3.

1:44
V.3 Seolpyo MPLchart(python fast candlestick chart)

1 view

7 days ago

Teensy Step to Project
​💻 Turn Any Image into a Pencil Sketch with Python! | Image Processing Tutorial 🚀

Want to learn how image filters work under the hood? ​In this video, we take a Teensy Step into Image Processing! 🖼️ We ...

6:25
​💻 Turn Any Image into a Pencil Sketch with Python! | Image Processing Tutorial 🚀

25 views

4 days ago

Marco Campolo
Coding a Smooth Mandelbrot Zoom in Python (Part 1)

n this video, I'll show you how to write a Python script that generates a stunning, smooth-shaded zoom animation straight into the ...

15:34
Coding a Smooth Mandelbrot Zoom in Python (Part 1)

1 view

4 days ago

Careertronicglobal
Python Data Analysis Visualization | Bar Chart, Pie Chart, Histogram 📊| #python #education #data #fy

Learn Data Visualization in Python with practical examples! In this video, you'll learn how to create and customize different types ...

14:36
Python Data Analysis Visualization | Bar Chart, Pie Chart, Histogram 📊| #python #education #data #fy

0 views

4 hours ago

Intellipaat
Learn Data Analytics Full Course for Beginners 2026 | Data Analytics Course Free | Intellipaat

Enroll for Data Analytics Course: https://intellipaat.com/data-analytics-master-training-course/ Book your Free ...

10:03:37
Learn Data Analytics Full Course for Beginners 2026 | Data Analytics Course Free | Intellipaat

1,137 views

18 hours ago

Roel Van de Paar
Adding text into bar-chart graph in Matplotlib (Python)

Adding text into bar-chart graph in Matplotlib (Python) Helpful? Please use the *Thanks* button above! Or, thank me via Patreon: ...

3:00
Adding text into bar-chart graph in Matplotlib (Python)

8 views

3 days ago

Dev w/Sel
Learning Data Science, ML & AI | Part 2: Visualizing Data with Matplotlib

I'm learning Data Science, Machine Learning, and AI step by step, and I'm turning the process into a video series. In Part 2, I ...

53:17
Learning Data Science, ML & AI | Part 2: Visualizing Data with Matplotlib

31 views

6 days ago

Datascience Monster
Hands-On Data Visualization in Python | Matplotlib & Seaborn for Beginners

In this hands-on Python data visualization tutorial, you will learn how to create powerful charts and graphs using Matplotlib and ...

19:43
Hands-On Data Visualization in Python | Matplotlib & Seaborn for Beginners

18 views

2 days ago

Simplilearn
Applied Data Science With Python Full Course 2026 [Free] | Python For Data Science | Simplilearn

Data Scientist Masters Program (Discount - YTBE15) ...

7:36:59
Applied Data Science With Python Full Course 2026 [Free] | Python For Data Science | Simplilearn

935 views

Streamed 1 day ago

Simplilearn
Applied Data Science With Python Full Course 2026 | Learn Data Science With Python | Simplilearn

Data Science Course ...

7:36:17
Applied Data Science With Python Full Course 2026 | Learn Data Science With Python | Simplilearn

2,853 views

3 days ago

Farjana Munmun
Visualizing data with matplotlib and python
8:32
Visualizing data with matplotlib and python

14 views

5 days ago

Simplilearn
AI With Python Full Course 2026 [FREE] | Learn Artificial Intelligence With Python | Simplilearn

Microsoft AI Engineer Program ...

6:24:59
AI With Python Full Course 2026 [FREE] | Learn Artificial Intelligence With Python | Simplilearn

2,120 views

Streamed 11 hours ago

Centro de Graduados de Ingeniería
Análisis y visualización de datos con Python - Modulo 1

Este curso se adentra en el mundo del análisis de datos con Python. Aprenderás a utilizar bibliotecas como pandas y Matplotlib ...

2:35:27
Análisis y visualización de datos con Python - Modulo 1

100 views

1 day ago

Simplilearn
AI With Python Full Course 2026 [FREE] | Learn Artificial Intelligence With Python | Simplilearn

Microsoft AI Engineer Program ...

6:24:51
AI With Python Full Course 2026 [FREE] | Learn Artificial Intelligence With Python | Simplilearn

542 views

Streamed 11 hours ago

Simplilearn
Python Full Course 2026 | Python Tutorial For Beginners | Python Programming Tutorial | Simplilearn

Professional Certificate in AI and Machine Learning ...

22:45:50
Python Full Course 2026 | Python Tutorial For Beginners | Python Programming Tutorial | Simplilearn

5,142 views

2 days ago

RR Consultancy Assignment Guidance
Multiple-Variables with BubbleCharts in Python Tutorial #python #datascience #education #programming

Mastering Data Visualisation:Plotting Multiple Variables with Bubble Charts in Python! Website: ...

2:07
Multiple-Variables with BubbleCharts in Python Tutorial #python #datascience #education #programming

0 views

16 hours ago

RR Consultancy Assignment Guidance
Comparing Categories with Stacked Bar Charts in Python- #python #datascience #programming #charts

Welcome back again guys! Visit Us: https://www.rrconsultancyservices.com/ Unlock the power of advanced data visualization!

1:58
Comparing Categories with Stacked Bar Charts in Python- #python #datascience #programming #charts

8 views

15 hours ago