Upload date
All time
Last hour
Today
This week
This month
This year
Type
All
Video
Channel
Playlist
Movie
Duration
Short (< 4 minutes)
Medium (4-20 minutes)
Long (> 20 minutes)
Sort by
Relevance
Rating
View count
Features
HD
Subtitles/CC
Creative Commons
3D
Live
4K
360°
VR180
HDR
14 results
... over here to my notebook and i am going to import matplotlib dot pi plot as as plt and then i say plt.subplots and um and in some ...
396 views
5 years ago
This lesson expands on the optogenetic spike train data we worked with in the previous chapter. Now we have data recorded from ...
522 views
4 years ago
Week 4: Tutorial 04 Part 01: Plotting In 1 D Using Python.
1,167 views
3 years ago
Hi everyone, welcome back to our channel. In this video, We're going to show how to view count plot for the data, and profiling the ...
324 views
2 years ago
RubyConf 2018 - RubyPlot - Creating a Plotting Library for Ruby by Pranav Garg The talk introduces Rubyplot - the plotting library ...
932 views
7 years ago
Heat maps are a more condensed, information-rich, and efficient version of the peri-stimulus time histograms (PSTHs) we saw in ...
681 views
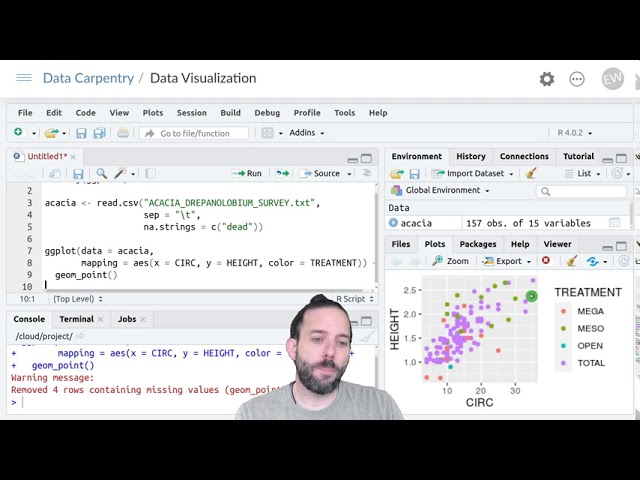
And that says: create a separate facet or subplot for each group that we want to divide things by. And to tell it which group, we put ...
554 views
Week 4: Tutorial 04 Part 02: Plotting In 2 D Using Python.
796 views
This chapter introduces data obtained from recordings of individual neurons, which we typically call single unit data (“units” being ...
1,822 views
Week 12: Lecture 59: Generating random samples using Python, Hypothesis Testing using Python.
587 views
The subplot command breaks the graphics window into a 2 by 2 matrix of sub-windows represented by the first two arguments in ...
389 views
11 years ago
Week 2: Tutorial 02 : Exploring Alos Palsar Data In Python.
4,694 views
For set the Font and Size of Title, X/Ylabel, and Numbers of Bode Diagram or Step Response; in Command Window of MATLAB ...
1,771 views
Software: Generic mapping Tools V6.1.1 Editor:vscode.
2,150 views