Upload date
All time
Last hour
Today
This week
This month
This year
Type
All
Video
Channel
Playlist
Movie
Duration
Short (< 4 minutes)
Medium (4-20 minutes)
Long (> 20 minutes)
Sort by
Relevance
Rating
View count
Features
HD
Subtitles/CC
Creative Commons
3D
Live
4K
360°
VR180
HDR
45 results
If you're still using console.log() to find and fix JavaScript issues, you might be spending more time debugging than you need to.
904,681 views
8 years ago
Developers use frameworks, multiple languages, and libraries to build their web applications. Browsers only see the resulting ...
10,707 views
2 years ago
In this episode (part 1 of 2), Robert is joined by Leslie Richardson, who shows several ways you can get the most out of Visual ...
34,269 views
6 years ago
Discover 5 different ways to debug your code beyond console.log - Discover the breakpoints, debugger statements, logpoints, ...
44,589 views
When you've got a frontend, a backend, and more in between, how do you debug issues? Lazar Nikolov teaches us how to use ...
2,669 views
Streamed 1 year ago
Why is YAML so hard!? The YAML extension not only helps you write valid YAML, but with schemas, it helps you discover ...
36,177 views
4 years ago
In this video, Sayed Hashimi shows how you can make the most of the debugger in Visual Studio for Mac. He will also ...
7,746 views
Visual Studio Code is a convenient cross-platform environment for writing Rust code. By installing and configuring a few extra ...
9,911 views
A good way to start investigating performance issues in your app is to understand its CPU usage. Profiler PM Esteban Herrera ...
31,469 views
5 years ago
Part of the NERSC New User Training on June 16, 2020. Please see ...
202 views
Tips on debugging CSS Flexbox with Chrome DevTools. Chapters: 0:00 - Intro 0:08 - Flexbox editor 0:49 - Flex badge and overlay ...
25,623 views
We provide a conceptual over of debugging. How to actually debug Java programs using Eclipse will be discussed in later videos ...
4,570 views
9 years ago
Understand how DevTools uses source maps, and how you can disable, configure and load source maps. Chapters: 0:00 Intro ...
27,306 views
In this Supercharged Live Code Session, Paul and Surma live code an accordion. They'll be making (and hopefully fixing!) bugs ...
20,057 views
Streamed 9 years ago
762 views
In diesem Video stelle ich euch arguments, apply und call vor und zeige euch, was der Debugger ist. Schau diese Videoserie von ...
4,635 views
11 years ago
Have you ever seen the dreaded "service worker can't load its script" error? Do you wonder why your caches don't seem to work?
19,687 views
In this episode of #AskChrome, Kayce and Adam from the Chrome team are here to answer your questions on DevTools.
5,563 views
Not sure what to do once you start experiencing performance issues in your application after shipping it? Use the profiling tools in ...
46,644 views
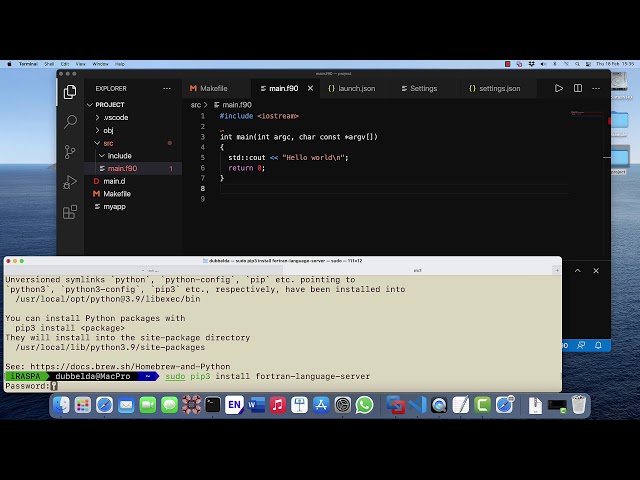
MacOS video part II is about the installation/configuration of Fortran compilers (via homebrew), the installation of the Fortran ...
6,695 views