ViewTube

ViewTube
Sign inSign upSubscriptions
Filters

Upload date

Type

Duration

Sort by

Features

Reset

1,775 results

Lore So What
4 simple tips to visualise your data #shorts

These are my 4 tips to visualise your data that I learned on the the way...

0:35
4 simple tips to visualise your data #shorts

695 views

3 years ago

TrishNiftyArt
Data Visualization and the Role of Artists

Prof Trish Gianakis Nov 2024 explains : Why Artists are Essential: Artists make complex data accessible, compelling, and ...

31:03
Data Visualization and the Role of Artists

14 views

1 year ago

Nataindata
Ditch ChatGPT and Excel for Data Analysis.Try Julius AI - Your Personal Data Analyst. #shorts

Try Julius AI - Your Personal Data Analyst: ✓ from Forecasting ✓ to generating Visualisations ✓ or training Neural Networks ✓ or ...

0:21
Ditch ChatGPT and Excel for Data Analysis.Try Julius AI - Your Personal Data Analyst. #shorts

11,454 views

2 years ago

IUT Business and Technology Management
Generative AI and Data Visualization: Turning data into compelling visuals.

Drowning in data but struggling to make it tell a story? See how Generative AI transforms complex data into clear, compelling ...

3:11
Generative AI and Data Visualization: Turning data into compelling visuals.

199 views

8 months ago

Visme
My Favorite Data Slides Powerpoint Maker

#graphmaker #datavisualization #slidedeck #powerpoint #presentation #consulting #sales #marketing #analyticsreport.

0:11
My Favorite Data Slides Powerpoint Maker

278 views

10 months ago

Promind AI
This is how you turn data into art with ProMind #microsoft #tech #office #aitools #ai

ProMind AI let's you plot graphs and various other visualisations for your data.

0:10
This is how you turn data into art with ProMind #microsoft #tech #office #aitools #ai

558 views

1 year ago

Data with Zach
Top 3 reasons why data engineering is better than data science! #dataengineer #datascience

Top three reasons why data engineering is a better career path than data science one it requires less education most data ...

0:42
Top 3 reasons why data engineering is better than data science! #dataengineer #datascience

135,125 views

1 year ago

Visme
My Favorite Graph Maker Tool

... charts, analytics reporting and it makes my data look SO good. #dataanalytics #datavisualization #dataviz #infographics #graph ...

0:11
My Favorite Graph Maker Tool

925 views

11 months ago

Alex The Analyst
#DataAnalyst #CareerPath

Let's take a look at the career path of a data analyst starting with an entry-level data analyst you just landed your first job what are ...

0:52
#DataAnalyst #CareerPath

102,182 views

2 years ago

Lore So What
skills to get hired in data #shorts

These are the top skills to get hired within the data space...

0:38
skills to get hired in data #shorts

509 views

3 years ago

Tracy Wanjera
Data visualization using Excel.

Using Excel to combine two datasets and perform data visualization.

4:09
Data visualization using Excel.

6 views

1 year ago

ana paints
Data Visualizations and Audience Sensitivities: Live Presentation (Audience View)
15:27
Data Visualizations and Audience Sensitivities: Live Presentation (Audience View)

1 view

6 months ago

Brenton Piercy
Cheaper Boat Data Visualization. Pt. 1

Trying to get all the data that's on my boat into a clean easy spot to view and log. Here I show the new touchscreen from adafruit ...

3:39
Cheaper Boat Data Visualization. Pt. 1

279 views

2 years ago

The Power BI Guy
Power BI can feel overwhelming. Stick through it and you can create some amazing reports #powerbi
0:15
Power BI can feel overwhelming. Stick through it and you can create some amazing reports #powerbi

1,234 views

1 year ago

DailyTech
🤖 Data Analysis with ChatGPT | Turn Raw Data into Insights Instantly

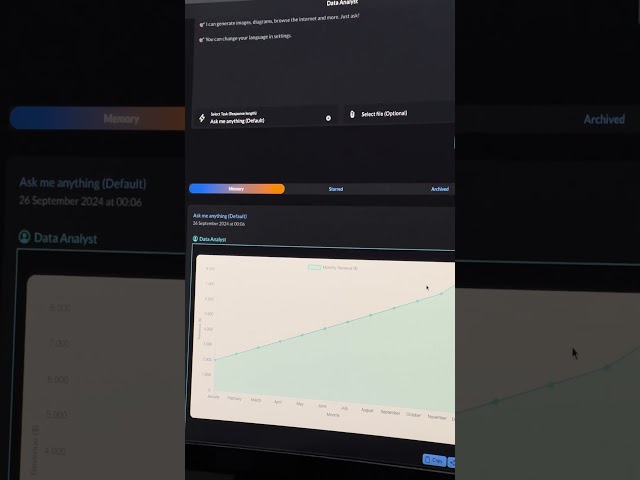
See how ChatGPT can analyze your data and generate insights in just minutes! In this video, I demonstrate how to: ✓ Upload ...

3:24
🤖 Data Analysis with ChatGPT | Turn Raw Data into Insights Instantly

71 views

5 months ago

Nod Coding Bootcamp
Choose The Perfect Visualization

Choosing the best visualization for your data is not always the easiest. Here are 5 tips on what charts to use and when ...

1:12
Choose The Perfect Visualization

663 views

9 months ago

Lore So What
Tableau vs Power BI - which one is better #shorts

Let's see which tool is better between Tableau and Power BI...

0:41
Tableau vs Power BI - which one is better #shorts

49,345 views

3 years ago

CS50
CS50R - Lecture 1 - Representing Data

This is CS50, Harvard University's introduction to the intellectual enterprises of computer science and the art of programming.

1:39:22
CS50R - Lecture 1 - Representing Data

56,804 views

1 year ago

Pradnya
Power BI for Beginners: your first step into Data Visualisation.

Welcome to your first step into Data Visualization! In this beginner-friendly video, I'll walk you through what Power BI is, why it's ...

7:41
Power BI for Beginners: your first step into Data Visualisation.

31 views

7 months ago

SportsBall
Katie Ledecky Dominance #sportsball #datavisualization #olympics #swimming

Katie Ledecky may just be the GOAT. We explain why the 1500m race is so brutal and how dominant Katie really is.

0:49
Katie Ledecky Dominance #sportsball #datavisualization #olympics #swimming

312 views

1 year ago