Upload date
All time
Last hour
Today
This week
This month
This year
Type
All
Video
Channel
Playlist
Movie
Duration
Short (< 4 minutes)
Medium (4-20 minutes)
Long (> 20 minutes)
Sort by
Relevance
Rating
View count
Features
HD
Subtitles/CC
Creative Commons
3D
Live
4K
360°
VR180
HDR
269 results
The Z-score method identifies outliers by measuring how far each data point is from the mean in terms of standard deviations.
93,807 views
4 years ago
Learn the concept clearly in under 1 minutes, explained step-by-step with examples! About MLQs Café Welcome to MLQs Café ...
74 views
5 months ago
For more math (and comedy), subscribe to my channel: https://www.youtube.com/jeffsuzuki1.
45 views
Here we talk about the idea of a p-value and statistical significance.
411 views
3 years ago
Explicamos como estandarizar y calcular las probabilidades.
355 views
5 years ago
Normalization, also known as Min-Max Scaling, is a technique that brings numerical features to a standard scale, preventing ...
183,994 views
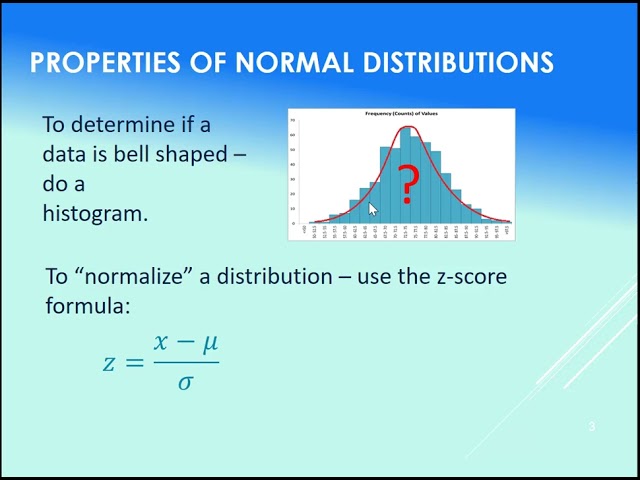
What is a normal distribution and what is a z-score? Want to know more on this subject? Go to my free OpenEd book: ...
150 views
1 year ago
In this episode Pat recorded the video in one take by live coding in R to show that typos, error messages, flaws in logic, confusion, ...
1,629 views
https://crumplab.github.io/psyc7709Lab/articles/Lab8_Normal.html.
69 views
This session covers how to calculate the z-score and find a normal probability. To access the recordings, you must join as a ...
130 views
4 months ago
Encontramos los valores que nos dan diversas probabilidades.
1,843 views
Lecture 18 : Data analysis: Normalization.
1,104 views
6 years ago
... 85 so Z values are just another way of thinking about this and normalizing this around standard deviation so what's the standard ...
41 views
... really quickly using the standardized equation now we could go compute z scores by hand computing the z-score by hand what ...
12,387 views
We use the "Stanine Scale" in all of our reports. There is a short paragraph in our reports that explain what the stanine score ...
21,966 views
11 years ago
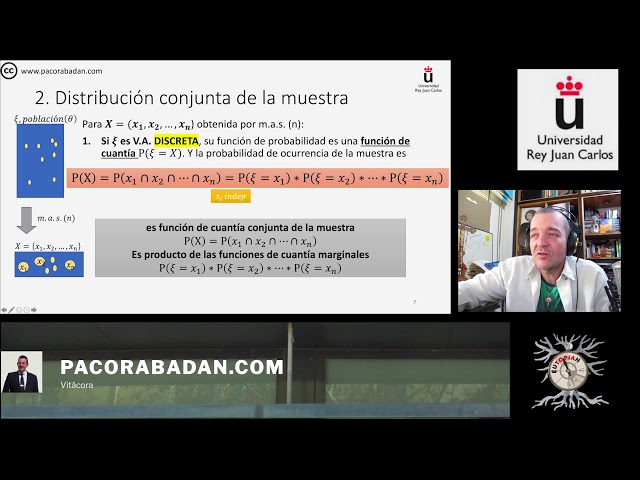
T1. Estadísticos y sus distribuciones. Debido a la pandemia del Covid-19, estoy grabando las clases para facilitar el aprendizaje ...
5,888 views
Probabilidad Normal Geométrica Suma de normales.
1,637 views
How to Calculate Z-Scores in Excel with Healthcare Benchmark Example This Quick Trainer tutorial walks you thru how to ...
193 views
さらに日本語のコンテンツをご覧になるには: https://sites.google.com/site/hepokiki/ This video is inspired by Khan Academy.
7,954 views
Given a data set, any raw observation or score can be transformed to what's known as z-score by subtracting the raw score from ...
305 views
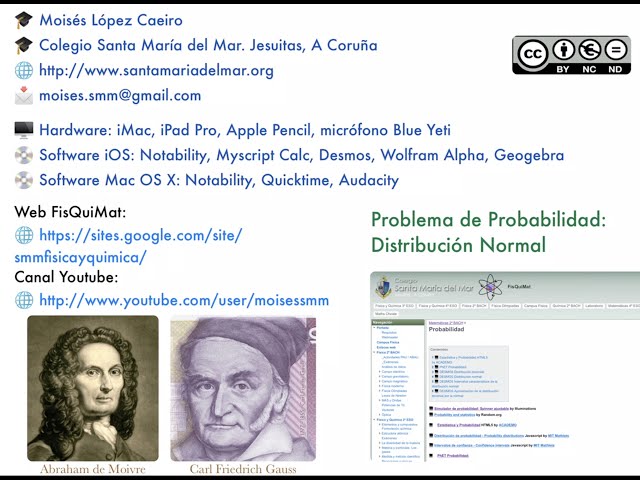
Teoría de probabilidades. Distribución Normal Gaussiana. Problema 01. Hardware: iMac, iPad Pro, micrófono Blue Yeti ...
91 views
Many data science models fail because the input variables exist on widely divergent scales. A common remedy is to standardize ...
546 views
1,423 views
This videos tutorials helps to understand Exploratory Data Analysis using pandas, matplotlib, numpy and seaborn libraries.
371 views
We learn how to use the z-tables to calculate the probability of measurement falling in a certain range.
38 views