ViewTube

ViewTube
Sign inSign upSubscriptions
Filters

Upload date

Type

Duration

Sort by

Features

Reset

627 results

Youven
Create Stunning Python Animations for Research Papers | Matplotlib Complete Guide

Bring your scientific data to life with animated visualizations! Learn how to create professional animations in Python using ...

41:13
Create Stunning Python Animations for Research Papers | Matplotlib Complete Guide

0 views

5 days ago

Akaza Coding
Plotting line with Matplotlib in python in 2 seconds #shorts #coding #python #yt #fyp
0:07
Plotting line with Matplotlib in python in 2 seconds #shorts #coding #python #yt #fyp

162 views

5 days ago

PyPlus
How to Create an Area Plot Using Python and Matplotlib?

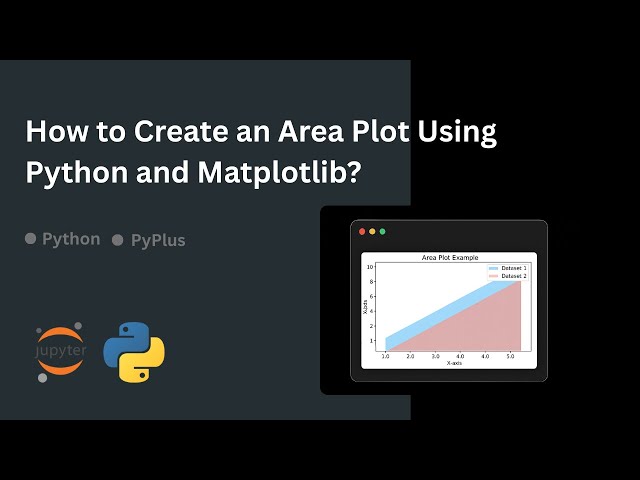
In this video, you'll learn how to create an area plot using Python with Matplotlib. Area plots are useful for visualizing trends over ...

2:17
How to Create an Area Plot Using Python and Matplotlib?

0 views

4 days ago

CodewithPrashant
Python Data Visualization Tools

Top Python Data Visualization Tools You Should Know Turn raw data into powerful insights with Python's most popular ...

0:07
Python Data Visualization Tools

5,125 views

4 days ago

Youven
Matplotlib Sketch Style Plots for Research Presentation (Complete Python Guide)

Learn how to create stunning hand-drawn sketch style plots in Matplotlib that make your research figures stand out!

10:16
Matplotlib Sketch Style Plots for Research Presentation (Complete Python Guide)

0 views

5 days ago

PyPlus
How to Visualize Programming Language Trends Using Python (2014–2024)?

In this video, you'll learn how to visualize programming language popularity trends using Python and Matplotlib. We plot ranking ...

6:05
How to Visualize Programming Language Trends Using Python (2014–2024)?

0 views

6 days ago

Easy Peasy Lemon Squeezy
Matplotlib Basics (Beginner Friendly) mindmap #coding #python #programming #matplotlib
0:07
Matplotlib Basics (Beginner Friendly) mindmap #coding #python #programming #matplotlib

0 views

6 days ago

Data con Edgar
El truco de Python que todo ingeniero de datos usa para gráficas #python #ingenieria #tutorial

Python, Ingeniería de Datos, Curso Python, Python Desde Cero, Aprender Python, Instalar Python, VS Code, Visual Studio Code, ...

2:20
El truco de Python que todo ingeniero de datos usa para gráficas #python #ingenieria #tutorial

676 views

12 hours ago

AI Evolutionary
How to Create a Filled Square Pattern in Python Using Matplotlib

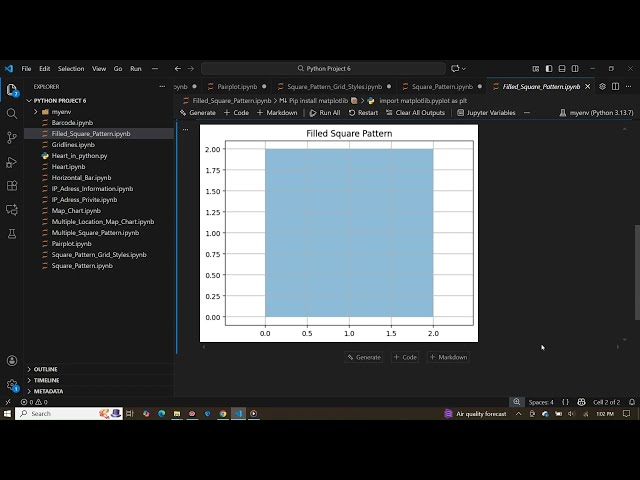
How to Create a Filled Square Pattern in Python Using Matplotlib In this video, you will learn how to create a filled square pattern ...

1:01
How to Create a Filled Square Pattern in Python Using Matplotlib

28 views

6 days ago

AI Evolutionary
Create a Horizontal Bar Chart with Labels in Python | Matplotlib Tutorial

Create a Horizontal Bar Chart with Labels in Python | Matplotlib Tutorial In this video, you will learn how to create a horizontal bar ...

0:52
Create a Horizontal Bar Chart with Labels in Python | Matplotlib Tutorial

32 views

4 days ago

GuideRealm
How To Install Python Libraries In Visual Studio Code - Step By Step

Learn how to install python libraries in visual studio code in this video. For more videos like this then please leave a like.

1:23
How To Install Python Libraries In Visual Studio Code - Step By Step

1,016 views

5 days ago

Velentena teach
Visualizing Linear Regression on Randomly Generated Data Using Python #machinelearning #Ai

In this video, we build and understand a Linear Regression model step by step using Python. We generate sample data, train a ...

20:39
Visualizing Linear Regression on Randomly Generated Data Using Python #machinelearning #Ai

20 views

7 days ago

Python Tyro
Line Chart, Bar Chart & Histogram in 12 Minutes | Class 12 IP | Plotting Data Using Matplotlib

Online CBSE Tuition & Doubt Clarification Sessions for Class 11 & 12 – Computer Science & Informatics Practices Contact: ...

15:08
Line Chart, Bar Chart & Histogram in 12 Minutes | Class 12 IP | Plotting Data Using Matplotlib

33 views

6 days ago

Digital Yash
AI Decision Surface in motion  Python + Matplotlib =Visual magic🔥#Python#Matplotlib#AIVisualization

Animated 3D Surface Visualization using Python & Matplotlib This video demonstrates a rotating and animated 3D surface ...

0:21
AI Decision Surface in motion Python + Matplotlib =Visual magic🔥#Python#Matplotlib#AIVisualization

0 views

17 hours ago

Corporate Connexion
Matplotlib Hands-On Coding Workshop | Master Data Visualization in 1 Hour!

Welcome to the Matplotlib Hands-On Coding Workshop! In this session, we will learn data visualization from scratch using Python ...

13:55
Matplotlib Hands-On Coding Workshop | Master Data Visualization in 1 Hour!

14 views

2 days ago

Corporate Connexion
Introduction to Data Visualization with Matplotlib | Python Beginner’s Guide

FREE EXCLUSIVE WORKSHOP ALERT! CLICK HERE TO JOIN THE MEETING FOR FREE: ...

10:05
Introduction to Data Visualization with Matplotlib | Python Beginner’s Guide

51 views

2 days ago

Eldar Mammadov Ilham
F1 Not Finished Races Analysis | Python Data Visualization with Pandas & Matplotlib #f1

In this Python data visualization tutorial, we analyze Formula 1 not finished races using pandas and matplotlib. What you'll ...

0:56
F1 Not Finished Races Analysis | Python Data Visualization with Pandas & Matplotlib #f1

0 views

4 days ago

omgod
Task 3: Exploratory Data Analysis (EDA) using Python | Beginner Project

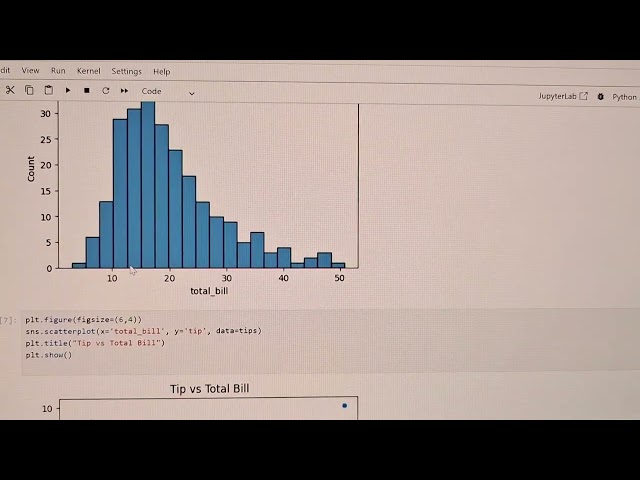
This video shows Exploratory Data Analysis using Python, Pandas, Matplotlib, and Seaborn. #internship #python Exploratory Data ...

0:53
Task 3: Exploratory Data Analysis (EDA) using Python | Beginner Project

0 views

5 days ago

Only Python
Core Python

Welcome to our Python learning channel! Here, you'll find easy-to-understand tutorials, coding challenges, and tips to enhance ...

0:16
Core Python

0 views

3 days ago

Mind Shift Facts
Stop guessing — Seaborn or Matplotlib? Here’s the answer

Seaborn and Matplotlib are two of the most popular Python libraries for data visualization — but they serve different purposes.

0:53
Stop guessing — Seaborn or Matplotlib? Here’s the answer

0 views

5 days ago