ViewTube

ViewTube
Sign inSign upSubscriptions
Filters

Upload date

Type

Duration

Sort by

Features

Reset

14 results

DeepWing
Matplotlib Crash Course: Python Data Visualization from Zero to Live Charts

Matplotlib is Python's most powerful data visualization library — and most tutorials only scratch the surface. This crash course ...

27:49
Matplotlib Crash Course: Python Data Visualization from Zero to Live Charts

21 views

4 days ago

Roel Van de Paar
Support for cloud9 ide and matplotlib or other graphical tool for python? (2 Solutions!!)

Support for cloud9 ide and matplotlib or other graphical tool for python? Helpful? Please use the *Thanks* button above! Or, thank ...

2:05
Support for cloud9 ide and matplotlib or other graphical tool for python? (2 Solutions!!)

1 view

2 days ago

RADHIKA'S CODE HUB
🚀 🐍Master Matplotlib📈 in 5 Minutes! |Easiest Way to Plot Graphs in Python 📊Matplotlib in Python#new

import matplotlib.pyplot as plt → Imports Matplotlib plotting module. plt.plot(x, y) → Draws a line graph. plt.title() → Adds a graph ...

4:35
🚀 🐍Master Matplotlib📈 in 5 Minutes! |Easiest Way to Plot Graphs in Python 📊Matplotlib in Python#new

17 views

5 days ago

Roel Van de Paar
Can't remove matplotlib's padding around imshow() figure

Can't remove matplotlib's padding around imshow() figure Helpful? Please use the *Thanks* button above! Or, thank me via ...

2:12
Can't remove matplotlib's padding around imshow() figure

0 views

3 days ago

RADHIKA'S CODE HUB
Visualizing Data Made Simple: Bar, Scatter & Histogram in matplotlib #coding #python

... इन Python के अंदर यहां पर हमारा प्रोग्राम है और यहां हमारा इसका आउटपुट ...

2:34
Visualizing Data Made Simple: Bar, Scatter & Histogram in matplotlib #coding #python

12 views

5 days ago

Roel Van de Paar
Creating a wordcloud with matplotlib

Creating a wordcloud with matplotlib Helpful? Please use the *Thanks* button above! Or, thank me via Patreon: ...

1:20
Creating a wordcloud with matplotlib

3 views

2 days ago

Programmers Picnic | Champak Roy
Quadratic Curve Fitting in Python | ML Preparation Lesson | Programmer's Picnic

This is the 4th and last video in our preparation series before starting Machine Learning programming. Before we begin Machine ...

39:20
Quadratic Curve Fitting in Python | ML Preparation Lesson | Programmer's Picnic

59 views

5 days ago

Programmers Picnic | Champak Roy
Polynomial Regression in Python | Best Fit Model, R² Score and Prediction

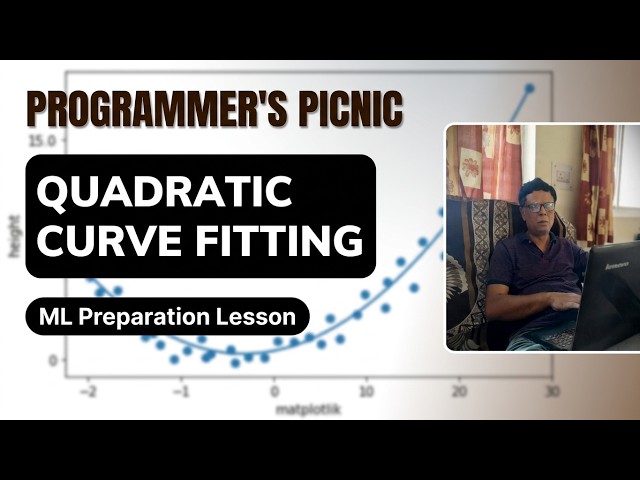
Description: In this lesson, we continue our Machine Learning preparation journey by learning how to fit polynomial models in ...

34:52
Polynomial Regression in Python | Best Fit Model, R² Score and Prediction

39 views

2 days ago

Roel Van de Paar
Separate two groups of bars in matplotlib

Separate two groups of bars in matplotlib Helpful? Please use the *Thanks* button above! Or, thank me via Patreon: ...

2:15
Separate two groups of bars in matplotlib

1 view

6 days ago

Prof. Mehar Chand
Welcome to the course on Python Programming: Fundamentals to Advanced Applications | AI | ML | DL |

Course Description Welcome to the course **Python Programming: Fundamentals to Advanced Applications | AI | ML | DL. Python ...

3:41
Welcome to the course on Python Programming: Fundamentals to Advanced Applications | AI | ML | DL |

38 views

10 hours ago

DEEPTI SHARMA: Let's Learn Programming
Pandas Series Mathematical Operations | Data Handling using Pandas #pythontutorial #pandasseries

Pandas Series Mathematical Operations | Data Handling using Pandas #pythontutorial #pandasseries #pythontutorial ...

24:27
Pandas Series Mathematical Operations | Data Handling using Pandas #pythontutorial #pandasseries

15 views

3 days ago

Roel Van de Paar
How to animate a 2D scatter plot given X, Y coordinates and time with appearing and disappearing...

How to animate a 2D scatter plot given X, Y coordinates and time with appearing and disappearing points? Helpful? Please use ...

4:14
How to animate a 2D scatter plot given X, Y coordinates and time with appearing and disappearing...

3 views

5 hours ago

Roel Van de Paar
One plot for each period from pandas dataframe

One plot for each period from pandas dataframe Helpful? Please use the *Thanks* button above! Or, thank me via Patreon: ...

2:39
One plot for each period from pandas dataframe

0 views

1 day ago

Roel Van de Paar
2D Histogram normalized for probabilities

2D Histogram normalized for probabilities Helpful? Please use the *Thanks* button above! Or, thank me via Patreon: ...

2:18
2D Histogram normalized for probabilities

3 views

5 days ago