Upload date
All time
Last hour
Today
This week
This month
This year
Type
All
Video
Channel
Playlist
Movie
Duration
Short (< 4 minutes)
Medium (4-20 minutes)
Long (> 20 minutes)
Sort by
Relevance
Rating
View count
Features
HD
Subtitles/CC
Creative Commons
3D
Live
4K
360°
VR180
HDR
887 results
Bring your scientific data to life with animated visualizations! Learn how to create professional animations in Python using ...
89 views
2 months ago
Create Amazing Animated Scatter Plots in Python | Matplotlib Animation Tutorial Bring your data to life! In this Python tutorial, I'll ...
79 views
6 months ago
In this video, I used Python and Matplotlib to visualize the sine function. The animation shows how sin(x) evolves as the angle ...
28 views
3 months ago
To learn for free on Brilliant, go to https://brilliant.org/techwithtim . Brilliant's also given our viewers 20% off an annual Premium ...
11,365 views
1 month ago
This video presents a 2D simulation of wave propagation within an ellipse-shaped domain, using finite difference methods to ...
187 views
9 months ago
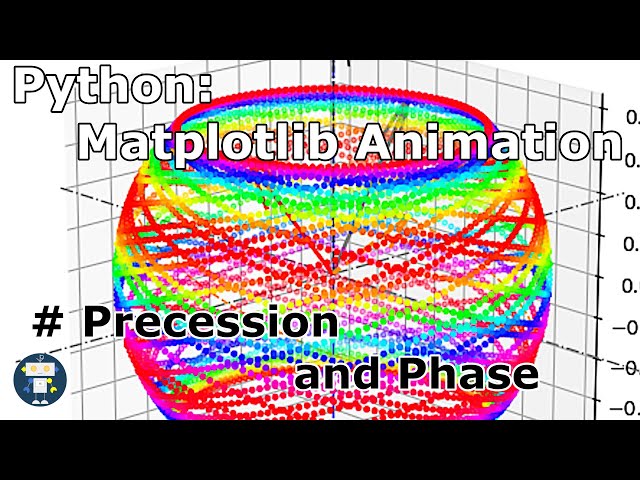
Precession and phase ## Source code GitHub https://github.com/marukatsutech/precession Files: * precession_phase.py.
8 views
Learn how to create stunning scatter plots using Matplotlib in Python! In this tutorial, we'll walk you through the basics of scatter ...
265 views
10 months ago
python #coding #matplotlib This video serves as an introduction to the Matplotlib Python library. We'll cover the basics of ...
89,288 views
4 months ago
In this tutorial, you'll learn how to create a smooth wave animation in Python using Matplotlib and FuncAnimation — all inside ...
13 views
Register for Intellipaat's Premium Data Science Course: https://intellipaat.com/data-scientist-course-training/ Access the ...
99,594 views
8 months ago
Learn how to effectively `clear previous scatter` points in your Matplotlib Python animations to create smooth, dynamic 3D graphs.
5 months ago
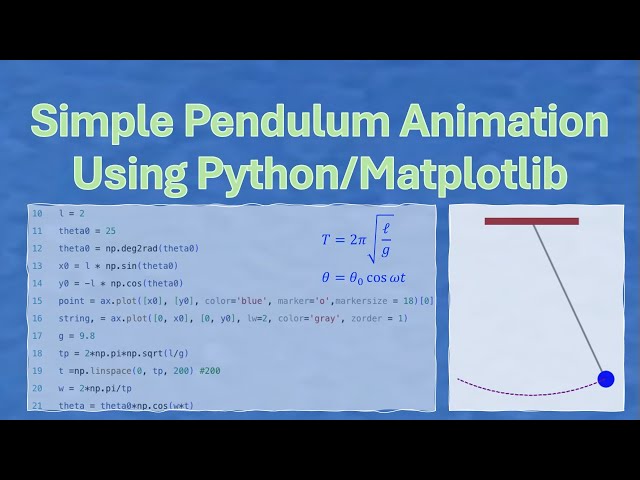
In this video, you will learn how to write a python program to do the animation of a simple pendulum. Step by step instructions are ...
23 views
I used python and matplotlib to create a variety of chart images and make them "animate" using stop motion. More animations ...
12 views
Animation Features: The plot evolves frame-by-frame from x = 0 to x = 10, drawing the sine wave in real time. x_data and y_data ...
9 views
Discover how to create an engaging animation using Python's Matplotlib to visualize grid color changes based on data over time.
4 views
Pie Charts Like a Pro – Python Matplotlib Advanced Tutorial + Animation Welcome to Py for Python – your go-to channel for ...
18 views
7 months ago
Welcome to your ultimate guide to Matplotlib in Python! In this video, you'll learn how to create stunning, professional data ...
If you're wondering whether to go for Matplotlib Animations (FuncAnimation) or Pygame for an animation with cropped images. 1.
179 views
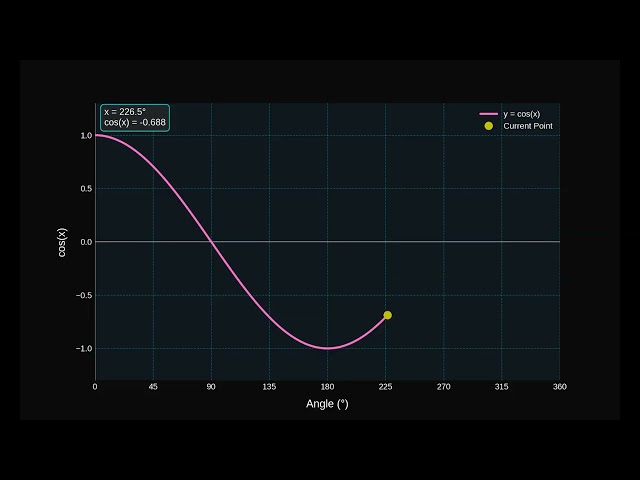
This is an animation on the cosine function — created entirely in Python using Matplotlib. It shows how cos(x) starts at 1 when the ...
6 views
Learn how to effectively use Matplotlib's animation capabilities to create and save multiple animations in Python. Follow our ...
0 views