Upload date
All time
Last hour
Today
This week
This month
This year
Type
All
Video
Channel
Playlist
Movie
Duration
Short (< 4 minutes)
Medium (4-20 minutes)
Long (> 20 minutes)
Sort by
Relevance
Rating
View count
Features
HD
Subtitles/CC
Creative Commons
3D
Live
4K
360°
VR180
HDR
693 results
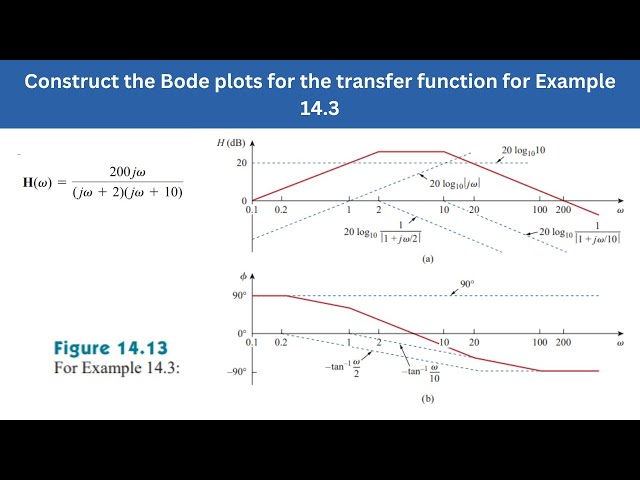
Okay so for this uh transfer function we have to construct the void plots for this so to construct this we're going to be using this table ...
81 views
2 months ago
So right now y'all are starting transfer functions and bodie plots and these will be on the test that you have right before the Easter ...
16 views
9 months ago
7,351 views
6 months ago
In this video (explained in Arabic), I show you how to find a transfer function using only the magnitude plot from a Bode diagram.
95 views
8 months ago
Okay so for the following transfer function we have to uh plot the void plots so first thing we need to do is get have everything be ...
132 views
This video presents our full analysis for Transfer Functions D and G, as part of the group assignment for BELK 1333. The video ...
39 views
21 views
Struggling with messy frequency response curves? In the 4th installment of our Origin Hacks: Tips & Tricks series, we dive deep ...
61 views
10 days ago
... from the bodie plots which is kind of interesting because bodlplot is a plot of the openloop transfer function and doesn't explicitly ...
236 views
4 months ago
https://youtu.be/UoXg1AhbD6o?si=TFWOPeSJiqTsZ1O5-FOR PHASE PLOT In this Video,We will see how to find the Magnitude ...
51 views
6,545 views
Join this channel to get access to perks: https://www.youtube.com/channel/UCEYToMV-SmbmkFAAsoGtSiw/join Welcome to KK ...
976 views
11 months ago
2,415 views
Animaría Montañez Mariana Saavedra.
2 views
7 months ago
3,314 views
5 views
71 views
A "Bode plot" in a control system is a graphical representation of a system's frequency response, typically displayed as two plots: ...
84 views
10 months ago
This video demonstrates the transfer function bode plot feature.
10 views
Find the transfer function with the Bode magnitude plot shown in Fig. 14.71.
48 views