Upload date
All time
Last hour
Today
This week
This month
This year
Type
All
Video
Channel
Playlist
Movie
Duration
Short (< 4 minutes)
Medium (4-20 minutes)
Long (> 20 minutes)
Sort by
Relevance
Rating
View count
Features
HD
Subtitles/CC
Creative Commons
3D
Live
4K
360°
VR180
HDR
10,599,125 results
You've probably heard the term data visualization thrown around a lot. It's why you're here, isn't it? So let's make it clear — data ...
178,224 views
3 years ago
View full lesson: http://ed.ted.com/lessons/david-mccandless-the-beauty-of-data-visualization David McCandless turns complex ...
1,562,595 views
13 years ago
Let's look at how we can implement design concepts and techniques to maximize the impact of our dashboards and reports.
85,398 views
4 years ago
Links mentioned in this video ⬇️ Exercise File ...
247,510 views
2 years ago
MENTORSHIP – Applications for the March 2026 cohort are now open! Apply here → https://theanalyticsaccelerator.com/ We're ...
45,916 views
10 months ago
Viewers like you help make PBS (Thank you ) . Support your local PBS Member Station here: http://to.pbs.org/Donateoffbook ...
508,527 views
12 years ago
Data visualization is present in every aspect of our lives - but is it really as unbiased as it's said to be? In this SciToons video, learn ...
136,225 views
7 years ago
Data storytelling is one of the most important skills for any data professional. Those who do it effectively can drive serious impact ...
22,353 views
1 year ago
Effective data visualisation comes in many shapes and sizes, but how do you move away from a standard bar chart? Watch the ...
78,521 views
Setup, conflict, resolution. You know right away when you see an effective chart or graphic. It hits you with an immediate sense of ...
624,889 views
6 years ago
"️ IBM - Data Analyst ...
317,709 views
8 years ago
In this video Rob, a Kaggle Grandmaster, quickly and humorously walks through each of the popular plotting and data ...
109,352 views
Learn Data Visualization with D3, JavaScript, and React. Part 2: https://youtu.be/H2qPeJx1RDI Created by @currankelleher .
518,825 views
Dustin hopes that the audience learns how anyone can use data visualization to improve their work, understand their world, and ...
72,211 views
In this video, we will demonstrate the difference between data visualization charts including: - Bar Chart - Line Chart - Bubble ...
187,205 views
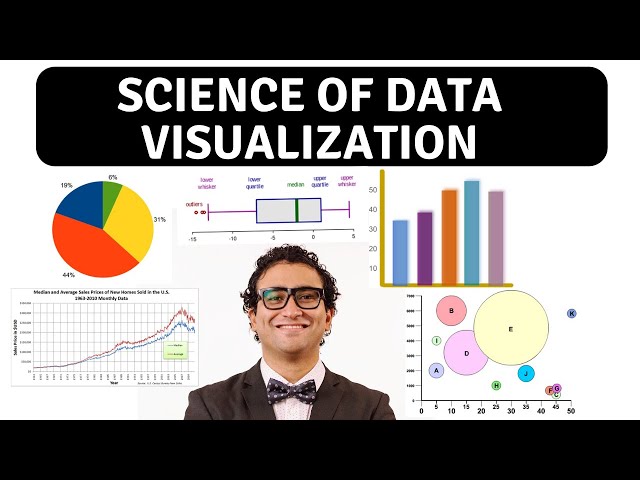
In this video, I break down some of the 'science' behind effective data visualization and how you can build better dashboards by ...
380,889 views
Following a look at 'Sensemaking' Associate Professor Dr Kai Xu delves into some more tricks of the visualisation trade.
75,319 views
Join my Academy, learn Data & AI skills and land a job https://analyticsautomation.academy/ Mind map available here ...
4,488 views
3 months ago
Learn data visualization with D3.js. D3 is a JavaScript library for manipulating documents based on data. D3 helps you bring data ...
363,963 views
Watch this mini-workshop delivered by best-selling author Cole Nussbaumer Knaflic. Cole demonstrates how to transform graphs ...
331,535 views
Streamed 2 years ago