ViewTube

ViewTube
Sign inSign upSubscriptions
Filters

Upload date

Type

Duration

Sort by

Features

Reset

346 results

roseindiatutorials
Matplotlib Tutorial in 30 Minutes 🔥 | Python Data Visualization for Beginners

Matplotlib Tutorial in 30 Minutes | Python Data Visualization for Beginners Learn Matplotlib in just 30 minutes This ...

34:06
Matplotlib Tutorial in 30 Minutes 🔥 | Python Data Visualization for Beginners

35 views

5 days ago

Software and Testing Training
Matplotlib Tutorial for Beginners | Plots, OO API, Backends & Crashes Explained

Matplotlib is powerful — but many developers struggle once they go beyond a simple plot. In this video, you'll unlock Matplotlib ...

8:12
Matplotlib Tutorial for Beginners | Plots, OO API, Backends & Crashes Explained

55 views

3 days ago

Vikash Udarsha
Matplotlib Basics: Data Analysis and Visualization with Python

An introductory notebook covering the fundamentals of data visualization using Matplotlib. This project demonstrates how to ...

0:30
Matplotlib Basics: Data Analysis and Visualization with Python

2 views

4 days ago

dota player
INTRODUCTORY TUTORIAL ON DATA SCIENCE LIBRARIES USING PYTHON (MATPLOTLIB)
19:57
INTRODUCTORY TUTORIAL ON DATA SCIENCE LIBRARIES USING PYTHON (MATPLOTLIB)

0 views

7 days ago

MACARANGAL, CHARLIE JR. A
Python Data Science Library: Matplotlib

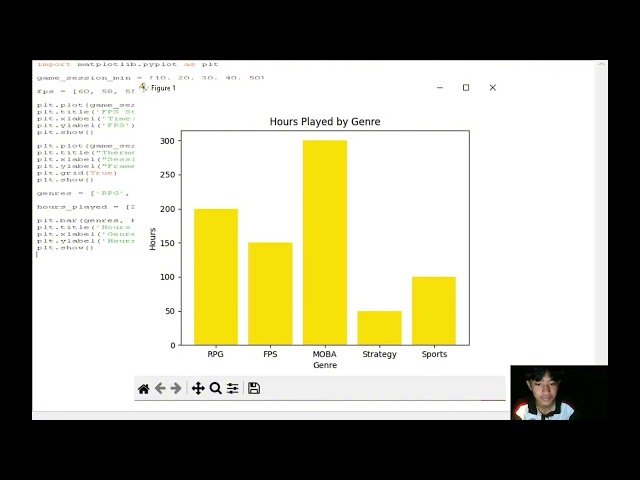
Charlie A. Macarangal Jr. BSMATH - 3A Fundamentals of Computing II - Final Project.

20:04
Python Data Science Library: Matplotlib

4 views

6 days ago

PyPlus
How Do You Create an Arc Twirl Pattern Using Python and Matplotlib?

In this video, you'll learn how to create an Arc Twirl Pattern using Python and Matplotlib. This visualization uses NumPy for ...

6:16
How Do You Create an Arc Twirl Pattern Using Python and Matplotlib?

0 views

4 days ago

AI Evolutionary
Create a Square Pattern Plot Using Python Matplotlib 📐

Create a Square Pattern Plot Using Python Matplotlib In this video, you will learn how to create a square pattern plot using ...

0:35
Create a Square Pattern Plot Using Python Matplotlib 📐

35 views

7 days ago

CodeLucky
Data Visualization Explained: Matplotlib & Seaborn Tutorial (2026)

Learn how to turn raw data into beautiful visual insights using Python's most powerful libraries: Matplotlib and Seaborn! In this ...

3:31
Data Visualization Explained: Matplotlib & Seaborn Tutorial (2026)

0 views

1 day ago

PyPlus
How Do You Create a Histogram Plot in Python Using Matplotlib?

In this video, you'll learn how to create a histogram plot in Python using Matplotlib. Histograms are widely used in data analysis to ...

1:30
How Do You Create a Histogram Plot in Python Using Matplotlib?

0 views

6 days ago

Mr.Anonymous Coder
Introduction to Histograms in Matplotlib: Master Data Distribution Visualization & Implementation

Introduction to Histograms in Matplotlib: Master Data Distribution Visualization & Implementation #matplotlib #datavisualization ...

1:26:15
Introduction to Histograms in Matplotlib: Master Data Distribution Visualization & Implementation

58 views

4 days ago

Mr.Anonymous Coder
Matplotlib Bar Graph ULTIMATE Guide (2025): Master Vertical, Horizontal, and Stacked Bar Charts

Matplotlib Bar Graph ULTIMATE Guide (2025): Master Vertical, Horizontal, and Stacked Bar Charts #matplotlib #python ...

1:20:44
Matplotlib Bar Graph ULTIMATE Guide (2025): Master Vertical, Horizontal, and Stacked Bar Charts

45 views

7 days ago

Erika Llames
Python Data Science Libraries Tutorial( Using Matplotlib, Numpy, and Pandas)
29:31
Python Data Science Libraries Tutorial( Using Matplotlib, Numpy, and Pandas)

0 views

4 days ago

Mr.Anonymous Coder
Matplotlib Styling ULTIMATE Guide (2025): Master Font Properties, Markers, and Line Customization

Matplotlib Styling ULTIMATE Guide (2025): Master Font Properties, Markers, and Line Customization #matplotlib #dataviz #python ...

1:23:16
Matplotlib Styling ULTIMATE Guide (2025): Master Font Properties, Markers, and Line Customization

42 views

7 days ago

Real Python
Explore Astrophysics with Pandas and Python! 🚀

Download your free Python Cheat Sheet here: https://realpython.com/cheatsheet Free Python Skill Test with instant level + ...

0:58
Explore Astrophysics with Pandas and Python! 🚀

0 views

2 hours ago

Series of Thoughts
Module 4:  Data Visualization with Matplotlib and Seaborn

Unlock the secrets of data visualization and transform your data science journey! In this presentation, you'll discover how to use ...

7:27
Module 4: Data Visualization with Matplotlib and Seaborn

0 views

7 days ago

Corporate Connexion
Learn Matplotlib by Coding Live | All Plots Explained in 10 Minutes

In this hands-on Matplotlib coding workshop, you will learn data visualization from scratch using Python by building charts live, ...

13:38
Learn Matplotlib by Coding Live | All Plots Explained in 10 Minutes

16 views

7 days ago

Mr.Anonymous Coder
Matplotlib Scatter Plots & Correlation Coefficient ULTIMATE Guide: Master Direction and Strength

Matplotlib Scatter Plots & Correlation Coefficient ULTIMATE Guide: Master Direction and Strength #matplotlib #datascience ...

1:21:49
Matplotlib Scatter Plots & Correlation Coefficient ULTIMATE Guide: Master Direction and Strength

63 views

6 days ago

Alex
Make a Chart in 15 Seconds! 🔥 Python Magic

Learn how to turn raw numbers into a beautiful chart in just 3 seconds using Python! Perfect for beginners or anyone who wants ...

0:20
Make a Chart in 15 Seconds! 🔥 Python Magic

343 views

4 days ago

Ralph Macatangay
PYTHON TUTORIAL | PART 3 OF 3 (MATPLOTLIB)
9:34
PYTHON TUTORIAL | PART 3 OF 3 (MATPLOTLIB)

0 views

4 days ago

Mon due code wala
Python Program: Multi-Color Pie Chart (Matplotlib)

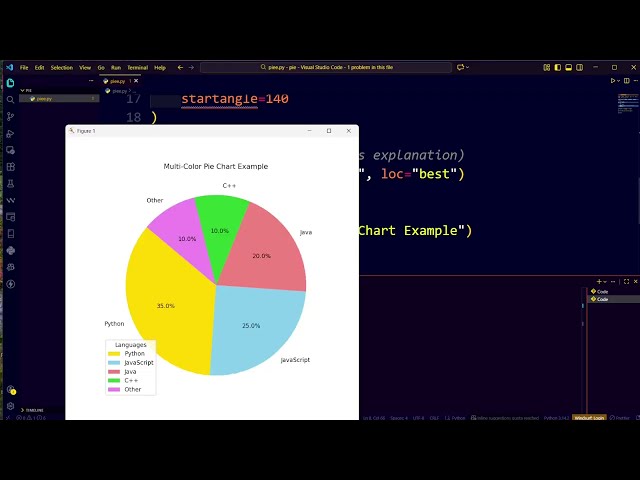
Python Program: Multi-Color Pie Chart (Matplotlib) What this code does Uses multiple colors 🏷️ Shows labels for each slice ...

0:53
Python Program: Multi-Color Pie Chart (Matplotlib)

0 views

7 days ago