ViewTube

ViewTube
Sign inSign upSubscriptions
Filters

Upload date

Type

Duration

Sort by

Features

Reset

13 results

Python Tyro
Plotting With PyPlot class XII IP Tamil | Data Visualization | Bar Chart | matplotlib |Class 12  IP

Online CBSE Tuition & Doubt Clarification Sessions for Class 11 & 12 – Computer Science & Informatics Practices Contact: ...

4:09
Plotting With PyPlot class XII IP Tamil | Data Visualization | Bar Chart | matplotlib |Class 12 IP

87 views

3 months ago

The Debug Zone
How to Create Continuous Color Maps with Pyplot Contourf in Matplotlib

In this video, we will explore the powerful capabilities of Matplotlib's `pyplot` library, specifically focusing on how to create ...

1:30
How to Create Continuous Color Maps with Pyplot Contourf in Matplotlib

1 view

1 month ago

Python Tyro
Plotting With PyPlot class XII IP Tamil | Data Visualization | Anatomy of Chart | matplotlib

Online CBSE Tuition & Doubt Clarification Sessions for Class 11 & 12 – Computer Science & Informatics Practices Contact: ...

12:36
Plotting With PyPlot class XII IP Tamil | Data Visualization | Anatomy of Chart | matplotlib

112 views

3 months ago

CoCalc by SageMath, Inc.
Plotting Using SunPy in Jupyter with CoCalc

Example Code: https://cocalc.com/share/public_paths/6a88ffb556fcbce40b11e11150dd344183370e35/Solar%20Images.ipynb ...

0:23
Plotting Using SunPy in Jupyter with CoCalc

39 views

8 months ago

The Debug Zone
How to Add a Legend in Matplotlib Based on Existing Color Series

In this video, we'll explore the process of adding a legend to your Matplotlib visualizations, specifically focusing on how to ...

1:29
How to Add a Legend in Matplotlib Based on Existing Color Series

9 views

9 months ago

Mathias Magdowski
Lcapy-Tutorial zum Plotten der Impedanzortskurve einer ohmisch-kapazitiven Schaltung als Fkt. von ω

In diesem kurzen Erklärvideo demonstriere ich, wie man mit der Lcapy-Bibliothek die Ortskurve der Gesamtimpedanz einer ...

13:14
Lcapy-Tutorial zum Plotten der Impedanzortskurve einer ohmisch-kapazitiven Schaltung als Fkt. von ω

75 views

6 months ago

Python Tyro
Line Chart, Bar Chart & Histogram in 12 Minutes | Class 12 IP | Plotting Data Using Matplotlib

Online CBSE Tuition & Doubt Clarification Sessions for Class 11 & 12 – Computer Science & Informatics Practices Contact: ...

15:08
Line Chart, Bar Chart & Histogram in 12 Minutes | Class 12 IP | Plotting Data Using Matplotlib

195 views

1 month ago

The Debug Zone
How to Format X-axis Labels in Matplotlib Using set_xticklabels

In this video, we'll explore the powerful capabilities of Matplotlib for customizing your data visualizations. Specifically, we'll focus ...

2:06
How to Format X-axis Labels in Matplotlib Using set_xticklabels

6 views

6 months ago

CoCalc by SageMath, Inc.
How to Use SunPy to Plot Solar Images in Jupyter Using CoCalc

Example Code: https://cocalc.com/share/public_paths/6a88ffb556fcbce40b11e11150dd344183370e35/Solar%20Images.ipynb ...

7:28
How to Use SunPy to Plot Solar Images in Jupyter Using CoCalc

191 views

8 months ago

CoCalc by SageMath, Inc.
How to Plot Linear Regression Using Python in Jupyter with CoCalc

What You'll Learn: Learn how to plot linear regressions using Python in a Jupyter Notebook on the CoCalc platform. This tutorial ...

7:27
How to Plot Linear Regression Using Python in Jupyter with CoCalc

334 views

9 months ago

Python Tyro
Plotting With PyPlot class XII IP Tamil | Data Visualization | Line Chart | matplotlib |Class 12  IP

Online CBSE Tuition & Doubt Clarification Sessions for Class 11 & 12 – Computer Science & Informatics Practices Contact: ...

4:50
Plotting With PyPlot class XII IP Tamil | Data Visualization | Line Chart | matplotlib |Class 12 IP

119 views

3 months ago

CoCalc by SageMath, Inc.
How to Create Stunning Data Visualizations with Seaborn in CoCalc

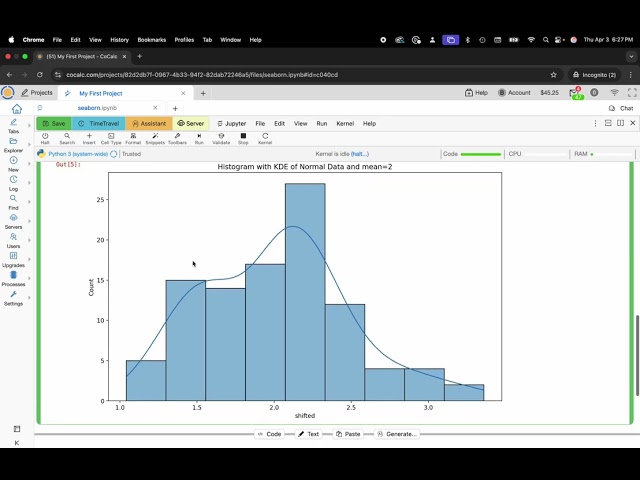
What You'll Learn: Learn how to create stunning data visualizations using Seaborn within CoCalc. Master the creation of ...

15:17
How to Create Stunning Data Visualizations with Seaborn in CoCalc

54 views

10 months ago

Mathias Magdowski
Lcapy-Tutorial zur Berechnung eines Schaltvorgangs o. Ausgleichsvorgangs (symbolisch und mit Zahlen)

In diesem kurzen Erklärvideo demonstriere ich, wie man mit der Lcapy-Bibliothek den Aufladevorgangs eines Kondensators über ...

14:41
Lcapy-Tutorial zur Berechnung eines Schaltvorgangs o. Ausgleichsvorgangs (symbolisch und mit Zahlen)

102 views

6 months ago