Upload date
All time
Last hour
Today
This week
This month
This year
Type
All
Video
Channel
Playlist
Movie
Duration
Short (< 4 minutes)
Medium (4-20 minutes)
Long (> 20 minutes)
Sort by
Relevance
Rating
View count
Features
HD
Subtitles/CC
Creative Commons
3D
Live
4K
360°
VR180
HDR
3,525 results
Introduces z-score tables for probability calculations and using z-scores to compare data values from related but different ...
12 views
2 months ago
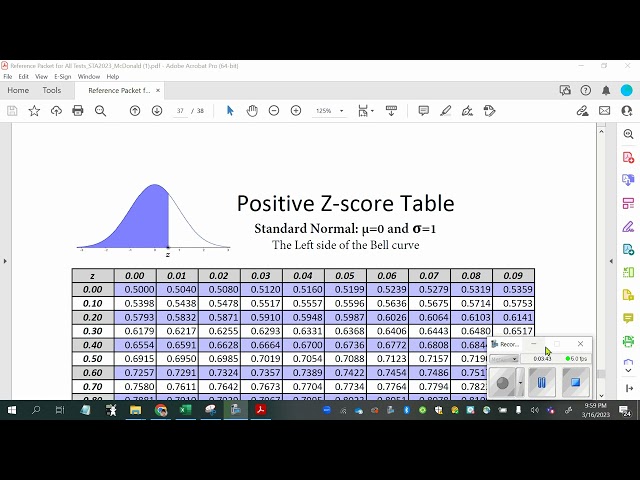
This video demonstrates how to read and interpret a Non-Cumulative Normal Distribution or Z Score Table. The table we use ...
873 views
5 years ago
This example is taken from Versatile Mathematics, an OER textbook created at Frederick Community College. The book can be ...
32,333 views
10 years ago
Using the z table to find areas under the normal curve.
639 views
This video is a supplementary material for the textbook entitled "A Step by Step Introduction to Statistics for Business" by Richard ...
138 views
7 years ago
A teacher with a large class finds that the class had exam scores that were forminig a bell shape curve. The teacher releases ...
2,560 views
14 years ago
An introduction to reading a standard normal distribution table, with an example of how to use it to find the area under the ...
3,861 views
8 years ago
In this video I have explained the meaning of z score and how you can find a random variable by looking up the z table for the ...
2,945 views
13 years ago
How to find z-scores using Excel given a population mean and standard deviation.
3,660 views
... is important to understand the difference between this kind of problem and problems in which we're given the Z score and then ...
5,194 views
4 years ago
Subscribe to our YouTube channel: http://goo.gl/s9AmD6 This video is brought to you by ExamLearn. ExamLearn is Ireland's ...
20,796 views
6 years ago
This lecture is part of the Introduction to Business Statistics course. See the full course at http://stats.proffriedman.net/. Professor ...
571 views
This video illustrates methodology for reading the Z-Score Tables.
508 views
11 years ago
This video demonstrates how to read and interpret a Cumulative Normal Distribution Table. We will calculate z scores and then ...
18,860 views
Kelsey discusses the normal distribution, z-scores, and their relation to probability.
402 views
9 years ago
This video explains Z Scores, how they are calculated and what they mean. We also review the Standard Normal Distribution and ...
787 views
All right so real quick if you're having trouble with getting z scores in jasp i'm going to do a quick demo on that i first want to note ...
9,906 views
3 years ago
This video shows how to use excel to find the area above or below Z scores in a normal distribution.
108 views
... point is 12 the mean is 8 and the standard deviation is 2.4 so the z score of above these per group is 1.67 and then in the table ...
203 views
Find z-score from known right area (using tables or Excel)
614 views
2 years ago