ViewTube

ViewTube
Sign inSign upSubscriptions
Filters

Upload date

Type

Duration

Sort by

Features

Reset

56 results

Alex The Analyst
Data Analyst Salaries | $50k to $175k

Data Analyst's Salaries vary widely depending on where you live, what industry you're in, and how many years of experience you ...

9:21
Data Analyst Salaries | $50k to $175k

2,312 views

10 hours ago

fortranized_pythonista
How do you normalize data from scratch #python

How do you normalize data from scratch using Python 3.14? How do i perform feature scaling from scratch using only numpy?

0:06
How do you normalize data from scratch #python

1,086 views

7 days ago

Alex The Analyst
Learn Databricks in Under 2 Hours

In this video we are diving into Databricks! We will get hands-on and learn how to Work with our data, use SQL Editor and ...

1:40:15
Learn Databricks in Under 2 Hours

12,011 views

7 days ago

The Statistics Lab
HADC 2025-12-02 (Meeting 196) Julius AI for Data Analysis

This is a live recording of our weekly meeting. We discuss R and Python Programming, statistics, work through tutorials, practice ...

57:28
HADC 2025-12-02 (Meeting 196) Julius AI for Data Analysis

10 views

7 days ago

fortranized_pythonista
How do you standardize data from scratch #python

How do you standardize data from scratch using Python 3.14? How do i implement Z-score normalization from scratch using only ...

0:07
How do you standardize data from scratch #python

1,854 views

3 days ago

UK DATA SERVICE
Working with Reddit data

This free workshop will introduce the fundamentals of natural language processing (NLP) and sentiment analysis, using Reddit as ...

1:21:52
Working with Reddit data

59 views

4 days ago

Gadeon
Looking at Some Machine Learning and Math Books

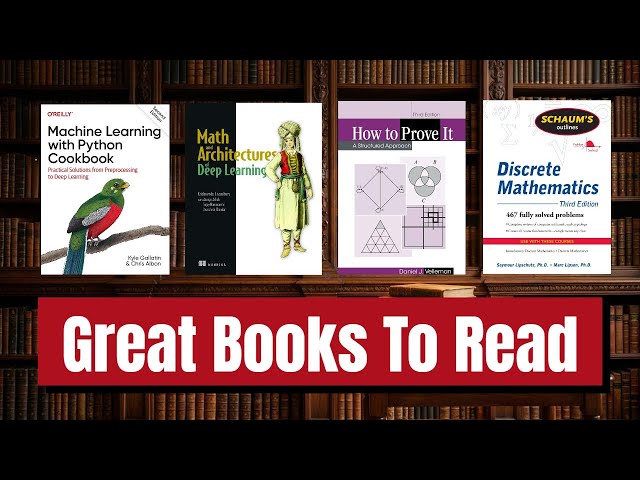
Hey John, this is John from Gadeon. Today, I'm sharing a new `book review` focusing on essential resources for `machine ...

17:03
Looking at Some Machine Learning and Math Books

26 views

4 days ago

The Debug Zone
How to Match Data Frames by Shortest Geographic Distance in Python

In this video, we will explore a powerful technique for matching data frames based on geographic proximity using Python.

1:59
How to Match Data Frames by Shortest Geographic Distance in Python

1 view

5 days ago

Analytics Benchmark
Data Analytics – Free Demo | Analytics Benchmark | 8374015055

Data Analytics – Free Demo | Analytics Benchmark Ready to build a career in Data Analytics? Join our Free Data Analytics ...

0:25
Data Analytics – Free Demo | Analytics Benchmark | 8374015055

13 views

3 days ago

The Debug Zone
How to Use Fillna with Most Frequent Value in Pandas DataFrame

In this video, we'll explore a powerful technique for handling missing data in Pandas DataFrames using the `fillna` method.

2:33
How to Use Fillna with Most Frequent Value in Pandas DataFrame

0 views

4 days ago

The Debug Zone
How to Add a 2D Colorbar or Color Wheel in Matplotlib: A Step-by-Step Guide

In this video, we'll explore the essential techniques for adding a 2D colorbar or color wheel in Matplotlib, a powerful plotting library ...

4:44
How to Add a 2D Colorbar or Color Wheel in Matplotlib: A Step-by-Step Guide

1 view

5 days ago

The Debug Zone
How to Stack a Square DataFrame to Retain Upper/Lower Triangle in Python

In this video, we delve into the fascinating world of data manipulation in Python, specifically focusing on how to stack a square ...

1:32
How to Stack a Square DataFrame to Retain Upper/Lower Triangle in Python

0 views

1 day ago

MLQs Café
Today’s Question: Principal Component Analysis (PCA) #interviewprep #machinelearning #datascience

Learn the concept clearly in under 1 minutes, explained step-by-step with examples! About MLQs Café Welcome to MLQs Café ...

0:45
Today’s Question: Principal Component Analysis (PCA) #interviewprep #machinelearning #datascience

16 views

7 days ago

Ahmad Varasteh
Build a Real-Time Sentiment Monitor for Customer Reviews with Python & AI

This entire video was generated by an AI agent. Visit us at https://orange-brackets.com/ to turn your notebooks into courses!

10:01
Build a Real-Time Sentiment Monitor for Customer Reviews with Python & AI

0 views

2 days ago

fortranized_pythonista
How to perform a robust scaling of data from scratch #python

How to perform a robust scaling of data from scratch using Python 3.14? How do i implement Robust Scaler from scratch using ...

0:11
How to perform a robust scaling of data from scratch #python

0 views

18 hours ago

BioniChaos
Kaggle Challenge: Preprocessing Wrist Sensor Data & Debugging AI Model Overfitting

This video documents the end-to-end process of tackling a Kaggle competition focused on the Helios wrist device. We explore the ...

40:18
Kaggle Challenge: Preprocessing Wrist Sensor Data & Debugging AI Model Overfitting

0 views

3 days ago

Art of Data
Box Plot #Python Visualization Day 3/30

In this scenario we will build a box plot from a sample dataset related to sales in different categories. using Seaborn library: ...

0:45
Box Plot #Python Visualization Day 3/30

151 views

3 days ago

Analytics Benchmark
Data Analysis training in hyderbad | demo| Analytics Benchmark | 8374015055

Ready to build a career in Data Analytics? Join our Free Data Analytics Demo Session and learn how tools like Power BI, Excel, ...

58:07
Data Analysis training in hyderbad | demo| Analytics Benchmark | 8374015055

17 views

8 hours ago

The Debug Zone
Fixing Pandas Concat: Columns of Same Category Turn to Object Type Issue

In this video, we tackle a common issue faced by data analysts and developers when using the Pandas library in Python: the ...

1:31
Fixing Pandas Concat: Columns of Same Category Turn to Object Type Issue

0 views

20 hours ago

The Debug Zone
How to Create Continuous Color Maps with Pyplot Contourf in Matplotlib

... #pythonplotting, #matplotlibtutorial, #contourplots, #colormapping, #dataanalysis, #scientificvisualization, #pythonprogramming, ...

1:30
How to Create Continuous Color Maps with Pyplot Contourf in Matplotlib

0 views

6 days ago

Art of Data
Plotting simple Line Chart in #python Day1/30 Python Visualization

python #pythonprogramming #pythontutorial #pythoninterview #pythonbeginner #python3 #pythonforbeginners #datanalyst ...

1:14
Plotting simple Line Chart in #python Day1/30 Python Visualization

39 views

7 days ago

The Debug Zone
How to Retain Categorical Data Type When Concatenating Pandas DataFrames

In this video, we delve into the intricacies of working with categorical data in Pandas, a powerful data manipulation library in ...

2:09
How to Retain Categorical Data Type When Concatenating Pandas DataFrames

0 views

6 hours ago

The Debug Zone
How to Convert Table Column to One-Hot Encoding in Python: A Step-by-Step Guide

... #datatransformation, #pythontutorial, #dataanalysis, #programming, #datamanipulation, #sklearn, #encodingtechniques, ...

2:05
How to Convert Table Column to One-Hot Encoding in Python: A Step-by-Step Guide

0 views

6 days ago

Prof. Mehar Chand
Lecture-5: Key Machine Learning Terminology  Features, Labels and Datasets  | ANN | ML | DL | DA

Understanding the core terminology of Machine Learning is essential for building strong foundations. In this lecture, Dr. Mehar ...

13:41
Lecture-5: Key Machine Learning Terminology Features, Labels and Datasets | ANN | ML | DL | DA

67 views

6 days ago

The Debug Zone
How to Extract Model Details from H2O Model Object in R and Python

... #dataanalysis, #predictivemodeling, #modelperformance, #programmingtutorial, #datavisualization, #statisticalmodeling, #ai, ...

2:55
How to Extract Model Details from H2O Model Object in R and Python

1 view

1 day ago