ViewTube

ViewTube
Sign inSign upSubscriptions
Filters

Upload date

Type

Duration

Sort by

Features

Reset

14 results

The Debug Zone
How to Create Continuous Color Maps with Pyplot Contourf in Matplotlib

In this video, we will explore the powerful capabilities of Matplotlib's `pyplot` library, specifically focusing on how to create ...

1:30
How to Create Continuous Color Maps with Pyplot Contourf in Matplotlib

1 view

1 month ago

Python Tyro
Plotting With PyPlot class XII IP Tamil | Data Visualization | Bar Chart | matplotlib |Class 12  IP

Online CBSE Tuition & Doubt Clarification Sessions for Class 11 & 12 – Computer Science & Informatics Practices Contact: ...

4:09
Plotting With PyPlot class XII IP Tamil | Data Visualization | Bar Chart | matplotlib |Class 12 IP

87 views

3 months ago

The Debug Zone
How to Add a Legend in Matplotlib Based on Existing Color Series

In this video, we'll explore the process of adding a legend to your Matplotlib visualizations, specifically focusing on how to ...

1:29
How to Add a Legend in Matplotlib Based on Existing Color Series

9 views

9 months ago

Python Tyro
Line Chart, Bar Chart & Histogram in 12 Minutes | Class 12 IP | Plotting Data Using Matplotlib

Online CBSE Tuition & Doubt Clarification Sessions for Class 11 & 12 – Computer Science & Informatics Practices Contact: ...

15:08
Line Chart, Bar Chart & Histogram in 12 Minutes | Class 12 IP | Plotting Data Using Matplotlib

178 views

1 month ago

Python Tyro
Plotting With PyPlot class XII IP Tamil | Data Visualization | Anatomy of Chart | matplotlib

Online CBSE Tuition & Doubt Clarification Sessions for Class 11 & 12 – Computer Science & Informatics Practices Contact: ...

12:36
Plotting With PyPlot class XII IP Tamil | Data Visualization | Anatomy of Chart | matplotlib

112 views

3 months ago

CoCalc by SageMath, Inc.
Plotting Using SunPy in Jupyter with CoCalc

Example Code: https://cocalc.com/share/public_paths/6a88ffb556fcbce40b11e11150dd344183370e35/Solar%20Images.ipynb ...

0:23
Plotting Using SunPy in Jupyter with CoCalc

38 views

8 months ago

The Debug Zone
How to Format X-axis Labels in Matplotlib Using set_xticklabels

In this video, we'll explore the powerful capabilities of Matplotlib for customizing your data visualizations. Specifically, we'll focus ...

2:06
How to Format X-axis Labels in Matplotlib Using set_xticklabels

6 views

5 months ago

Python Tyro
Plotting With PyPlot class XII IP Tamil | Data Visualization | Line Chart | matplotlib |Class 12  IP

Online CBSE Tuition & Doubt Clarification Sessions for Class 11 & 12 – Computer Science & Informatics Practices Contact: ...

4:50
Plotting With PyPlot class XII IP Tamil | Data Visualization | Line Chart | matplotlib |Class 12 IP

119 views

3 months ago

CoCalc by SageMath, Inc.
How to Plot Linear Regression Using Python in Jupyter with CoCalc

What You'll Learn: Learn how to plot linear regressions using Python in a Jupyter Notebook on the CoCalc platform. This tutorial ...

7:27
How to Plot Linear Regression Using Python in Jupyter with CoCalc

325 views

9 months ago

CoCalc by SageMath, Inc.
How to Use SunPy to Plot Solar Images in Jupyter Using CoCalc

Example Code: https://cocalc.com/share/public_paths/6a88ffb556fcbce40b11e11150dd344183370e35/Solar%20Images.ipynb ...

7:28
How to Use SunPy to Plot Solar Images in Jupyter Using CoCalc

191 views

8 months ago

Mathias Magdowski
Lcapy-Tutorial zum Plotten der Impedanzortskurve einer ohmisch-kapazitiven Schaltung als Fkt. von ω

In diesem kurzen Erklärvideo demonstriere ich, wie man mit der Lcapy-Bibliothek die Ortskurve der Gesamtimpedanz einer ...

13:14
Lcapy-Tutorial zum Plotten der Impedanzortskurve einer ohmisch-kapazitiven Schaltung als Fkt. von ω

75 views

6 months ago

CoCalc by SageMath, Inc.
How to Create Stunning Data Visualizations with Seaborn in CoCalc

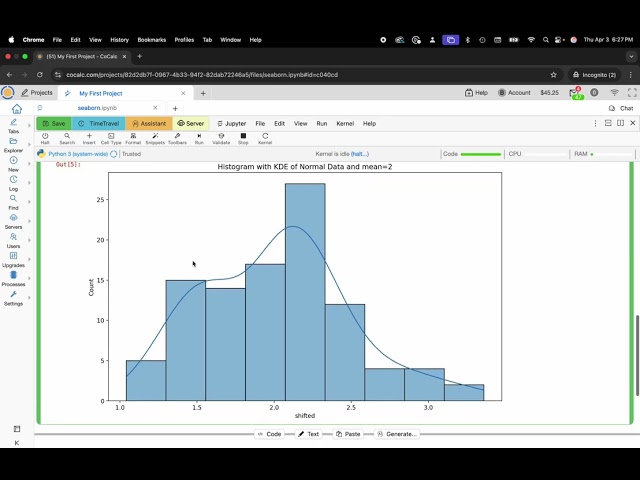
What You'll Learn: Learn how to create stunning data visualizations using Seaborn within CoCalc. Master the creation of ...

15:17
How to Create Stunning Data Visualizations with Seaborn in CoCalc

54 views

9 months ago

Mathias Magdowski
Lcapy-Tutorial zur Berechnung eines Schaltvorgangs o. Ausgleichsvorgangs (symbolisch und mit Zahlen)

In diesem kurzen Erklärvideo demonstriere ich, wie man mit der Lcapy-Bibliothek den Aufladevorgangs eines Kondensators über ...

14:41
Lcapy-Tutorial zur Berechnung eines Schaltvorgangs o. Ausgleichsvorgangs (symbolisch und mit Zahlen)

102 views

6 months ago

Python Tyro
CBSE Class 12 Computer Science /Informatics Practice LIVE Revision | Full Syllabus Explained  Tamil

CBSE Class 12 Computer Science / IP – FULL SYLLABUS REVISION (Tamil) Class 12 Computer Science Python Revision Tour: ...

CBSE Class 12 Computer Science /Informatics Practice LIVE Revision | Full Syllabus Explained Tamil

0 views

2 weeks ago