Upload date
All time
Last hour
Today
This week
This month
This year
Type
All
Video
Channel
Playlist
Movie
Duration
Short (< 4 minutes)
Medium (4-20 minutes)
Long (> 20 minutes)
Sort by
Relevance
Rating
View count
Features
HD
Subtitles/CC
Creative Commons
3D
Live
4K
360°
VR180
HDR
1,510 results
Performance debugging just got a whole lot easier. Learn how our new Chrome DevTools Performance panel is more accessible ...
17,810 views
7 months ago
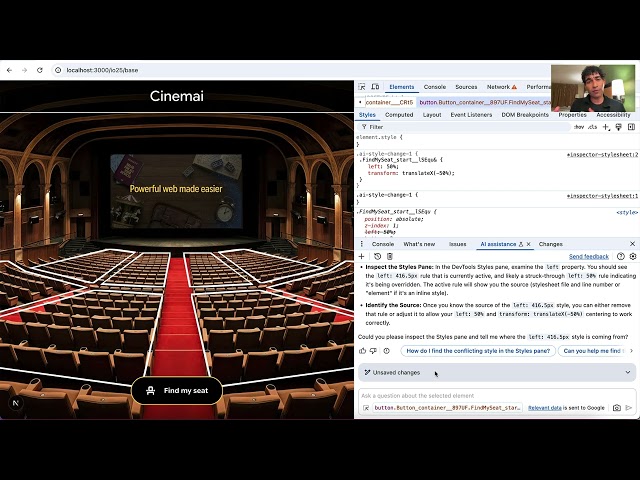
At #googleio, we announced AI assistance _across_ DevTools, enabling you to chat with Gemini to debug smarter. You can now ...
1,211 views
Enhance your development experience with the exciting updates in Chrome DevTools 142-144. This video demonstrates Code ...
11,284 views
1 month ago
Explore advanced Network panel techniques, including how to find performance bottlenecks, debug popups, configure network ...
17,249 views
10 months ago
Let's dive in~ Explore the latest DevTools features in Chrome 139-141 with Matthias! Chapters: 0:00 - Introduction 0:35 - Network ...
56,467 views
3 months ago
Talk: Debugging performance issues with the Flutter DevTools Speaker: Alexandre Moureaux Event: Fluttercon EU 2024 ...
228 views
5 months ago
CLS is short for Cumulative Layout Shift (CLS. Debug CLS with Performance Insights in the updated Chrome DevTools ...
37,583,714 views
LCP is short for Largest Contentful Paint. Debug LCP with Performance Insights in the updated Chrome DevTools Performance ...
36,384,984 views
The introduction of AI assistance for styling, network, sources, and performance Chrome DevTools means you can do more with a ...
66,994 views
Announcing ChromeDevTools MCP! Connect your AI coding agent to Chrome's powerful automation & debugging capabilities ...
13,784 views
Learn how to capture the full network activity of pop-up windows in Chrome DevTools. Watch more DevTools Tips ...
3,997 views
Never quite know what's going on in your nested CSS calculations? Head over to the Styles panel, hover over a CSS value with ...
5,764 views
6 months ago
Boost your development workflow with Gemini integrated directly into Chrome DevTools. With AI assistance, you can now get ...
21,261,471 views
In this video, we'll explore the essential process of saving coverage results from Chrome DevTools, a powerful tool for web ...
15 views
8 months ago
Baseline is now available in DevTools! Learn how this update allows developers to know if a property has limited availability, ...
73,838,970 views
Source: https://stackoverflow.com/questions/79629915 Question Author: - Chen Peleg https://stackoverflow.com/users/11494445 ...
33 views
Buckle up for a deep dive into web performance optimization with Chrome DevTools! Matthias guides you through the updated ...
8,588 views
2 months ago
In this video, we'll explore the powerful capabilities of Chrome DevTools, specifically focusing on the Coverage feature. Whether ...
10 views
Discover how you can access Gemini directly in DevTools. Check out “AI innovations #DevToolTips” to learn more about the AI ...
2,272 views
4 months ago
Discover custom functions, one of Una's favorite features from CSS Wrapped 2025. Functions make it alot easier to architect your ...
16,040 views