Upload date
All time
Last hour
Today
This week
This month
This year
Type
All
Video
Channel
Playlist
Movie
Duration
Short (< 4 minutes)
Medium (4-20 minutes)
Long (> 20 minutes)
Sort by
Relevance
Rating
View count
Features
HD
Subtitles/CC
Creative Commons
3D
Live
4K
360°
VR180
HDR
158,859 results
If you're still using console.log() to find and fix JavaScript issues, you might be spending more time debugging than you need to.
898,711 views
7 years ago
Edebug, instrumenting and stepping and breakpoints. Also macroexpand and how it helps with debugging.
9,359 views
11 years ago
Performance debugging just got a whole lot easier. Learn how our new Chrome DevTools Performance panel is more accessible ...
17,080 views
7 months ago
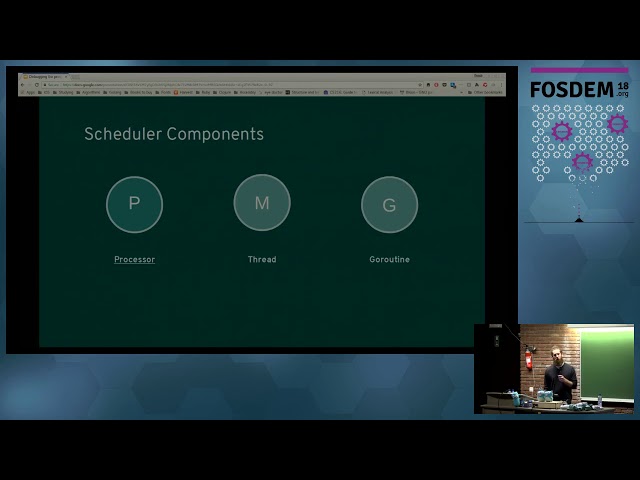
by Derek Parker At: FOSDEM 2018 Room: H.1308 (Rolin) Scheduled start: 2018-02-03 11:00:00+01.
10,402 views
Tutorial: Debugging Embedded Devices using GDB - Chris Simmonds, 2net Ltd.
18,247 views
5 years ago
Linux Kernel Debugging: Going Beyond Printk Messages - Sergio Prado, Embedded Labworks* Debugging the Linux kernel with ...
16,669 views
I do a demonstration of writing and debugging x86 assembly language code using the MS-DOS debug utility. 00:00 ...
10,228 views
3 years ago
Te mostramos cómo depurar un programa en Python 3 utilizando el editor Visual Studio Code. ▻▻ Suscríbete para seguir ...
40,912 views
6 years ago
Mentor: Joel Fernandes, Staff Software Engineer, Google In this enlightening webinar, "Linux Kernel Debugging Tricks of the ...
14,254 views
2 years ago
https://devtoolsforbeginners.kevinpowell.co/ ✓ https://polypane.app/?ref=kevin (this is an affiliate link, so if you do purchase after ...
21,418 views
4 months ago
You can find the lecture notes and exercises for this lecture at https://missing.csail.mit.edu/2020/debugging-profiling/ Help us ...
100,757 views
To watch this keynote interpreted in American Sign Language (ASL), please click here → https://goo.gle/3LYclAp Learn how new ...
29,989 views
Knowing your enemies is as important as knowing your friends. Understanding your debugger is a little of both. Have you ever ...
863 views
https://media.ccc.de/v/ASG2018-213-a_debugger_from_scratch At some stage in your programming life you may well have used ...
6,997 views
Jake and Surma tackle one of the hardest types of debugging on the web: Memory leaks. Some links mentioned: Squoosh ...
51,259 views
4 years ago
Learn about the AI assistance panel in DevTools, designed to help with CSS styling and more. Learn more at ...
1,631 views
11 months ago
Developers use frameworks, multiple languages, and libraries to build their web applications. Browsers only see the resulting ...
10,635 views
It is less about squashing bugs but more about answering the question "what happened" that a nasty product manager or ...
2,888 views
8 years ago
Interaction to Next Paint (INP) is a Core Web Vital that measures how responsive a page is to interactions. Due to INP's scope, ...
7,642 views
1 year ago
What's the quickest way to debug PHP code? Using error_reporting can show all errors quickly. Combine it with ...
955 views