Upload date
All time
Last hour
Today
This week
This month
This year
Type
All
Video
Channel
Playlist
Movie
Duration
Short (< 4 minutes)
Medium (4-20 minutes)
Long (> 20 minutes)
Sort by
Relevance
Rating
View count
Features
HD
Subtitles/CC
Creative Commons
3D
Live
4K
360°
VR180
HDR
6,813 results
... IBM Data Analysis Specialization - https://coursera.pxf.io/AoYOdR Tableau Data Visualization - https://coursera.pxf.io/MXYqaN ...
322,257 views
10mo ago
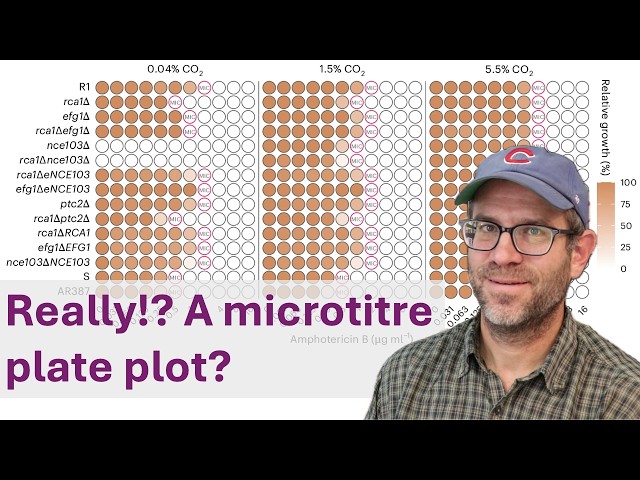
After critiquing this figure and recreating it, now it's time to see if we can't improve it in R.
441 views
Streamed 11mo ago
Check out all my Full Courses on Analyst Builder: https://www.analystbuilder.com/ 25% Off Analyst Builder Code: BOOTCAMP In ...
1,066,880 views
5mo ago
An overview of the emergence, key moments, and examples from the history of data art, along with a presentation of selected ...
239 views
7mo ago
Pat carries out a constructive critique of a set of panels displaying dose response curves of a bacterial toxin on different mutants.
1,013 views
This is a recording of a talk given by Kate Isaac about best practices for data visualizations, especially for complex data for the ...
9 views
9mo ago
Pat critiques a figure from a paper published in the scientific journal Nature Microbiology that showed the response of the virus ...
689 views
8mo ago
Pat critiques a figure from a paper published in the scientific journal Nature Microbiology that created a unique heatmap that ...
747 views
This unit includes: -History and impact of data visualization. -Related professional areas. -Data formats to visualize. -Types of ...
59 views
1mo ago
35,880 views
3mo ago
In this video you will learn how to turn simple CSV data into a professional 3D bar chart using Blender and Python. We walk ...
37 views
Streamed 8mo ago
Federica Gazzelloni leads a discussion of Chapter 1 ("Data visualization") from R for Data Science by Hadley Wickham, Mine ...
215 views
4mo ago
The article discussed: https://www.nature.com/articles/s41564-026-02350-2 Related livestream: ...
818 views
SARA Institute was founded in April 2023 by Dr. Ajay Kumar Koli & Dr. Kiran Lata. How to Donate to SARA: UPI ID: ...
172 views
11mo ago
https://media.ccc.de/v/emf2026-241-1-data-visualisation-the-good-the-bad-the-ugly (Alt title - Look at this Graph: How to make ...
394 views
NotebookLM for Research May 21, 2026 By Francesca Albrezzi This new OARC Youtube playlist is designed to transform ...
360 views
Ahmed_Sami #Arabic_Big_Data Exploratory Data Analysis using Python To support via PayPal ...
39,681 views
Arthur Shaw leads a discussion of Chapter 26 ("Don't go 3D") and Chapter 27 ("Understanding the most commonly used image ...
85 views
"Cella: 3D Data Visualization for Plant Single-Cell Transcriptomics" by Sampo Muranen at Blender Conference 2026 Recent ...
1,092 views
4w ago
Matplotlib is Python's most powerful data visualization library — and most tutorials only scratch the surface. This crash course ...
42 views