ViewTube

ViewTube
Sign inSign upSubscriptions
Filters

Upload date

Type

Duration

Sort by

Features

Reset

242 results

Alex The Analyst
Learn Databricks in Under 2 Hours

... Google Data Analyst Certification: https://coursera.pxf.io/5bBd62 Data Analysis with Python - https://coursera.pxf.io/BXY3Wy IBM ...

1:40:15
Learn Databricks in Under 2 Hours

21,366 views

2 weeks ago

AI Tools Quest
I Turned ChatGPT 5 2 Into My Data Analyst

What if ChatGPT 5.2 could be your data analyst in under 60 seconds? Watch it clean messy datasets, find trends, write Excel ...

2:59
I Turned ChatGPT 5 2 Into My Data Analyst

0 views

8 days ago

Alex The Analyst
Data Analyst Salary in 2025: $50k to $175k

... Google Data Analyst Certification: https://coursera.pxf.io/5bBd62 Data Analysis with Python - https://coursera.pxf.io/BXY3Wy IBM ...

9:21
Data Analyst Salary in 2025: $50k to $175k

5,921 views

13 days ago

fortranized_pythonista
How to perform a robust scaling of data from scratch #python

How to perform a robust scaling of data from scratch using Python 3.14? How do i implement Robust Scaler from scratch using ...

0:11
How to perform a robust scaling of data from scratch #python

395 views

13 days ago

fortranized_pythonista
How do you standardize data from scratch #python

How do you standardize data from scratch using Python 3.14? How do i implement Z-score normalization from scratch using only ...

0:07
How do you standardize data from scratch #python

1,856 views

2 weeks ago

The Debug Zone
Generate 5000 Rows of Random Data with Python Faker: A Step-by-Step Guide

In this video, we'll dive into the world of data generation using Python's Faker library. Whether you're a developer, data analyst, ...

2:08
Generate 5000 Rows of Random Data with Python Faker: A Step-by-Step Guide

4 views

1 month ago

The Statistics Lab
HADC 2025 12 09 197 Visualising survey data in R

This is a live recording of our weekly meeting. We discuss R and Python Programming, statistics, work through tutorials, practice ...

57:57
HADC 2025 12 09 197 Visualising survey data in R

0 views

10 days ago

The Statistics Lab
HADC 2025-12-02 (Meeting 196) Julius AI for Data Analysis

This is a live recording of our weekly meeting. We discuss R and Python Programming, statistics, work through tutorials, practice ...

57:28
HADC 2025-12-02 (Meeting 196) Julius AI for Data Analysis

11 views

2 weeks ago

Sujeet Kumar Advanced Excel Training in Hindi
Day- Python for Data Analysis and Visualization- Course

Download Excel VBA MIS Learning - App - https://play.google.com/store/apps/details?id=co.hodor.jqijz iOS - https://apps ...

26:32
Day- Python for Data Analysis and Visualization- Course

32 views

3 weeks ago

Gadeon
Looking at Some Machine Learning and Math Books

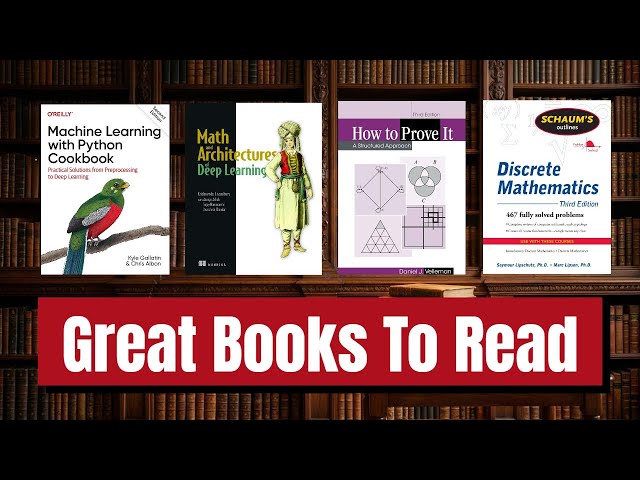
Today, I'm sharing a new `book review` focusing on essential resources for `machine learning`. We'll explore various `books for ...

17:03
Looking at Some Machine Learning and Math Books

69 views

2 weeks ago

Sujeet Kumar Advanced Excel Training in Hindi
Fastest Data Cleaning Trick 🔥#python #dataanalysis #datacleaning #coding

Download Excel VBA MIS Learning - App - https://play.google.com/store/apps/details?id=co.hodor.jqijz iOS ...

0:56
Fastest Data Cleaning Trick 🔥#python #dataanalysis #datacleaning #coding

26 views

3 weeks ago

UK DATA SERVICE
Working with Reddit data

This free workshop will introduce the fundamentals of natural language processing (NLP) and sentiment analysis, using Reddit as ...

1:21:52
Working with Reddit data

101 views

2 weeks ago

The Debug Zone
Clustering Time Series Data in Python: Techniques and Best Practices

In this video, we delve into the fascinating world of clustering time series data using Python. As the volume of time-dependent data ...

2:05
Clustering Time Series Data in Python: Techniques and Best Practices

0 views

3 weeks ago

fortranized_pythonista
How do you normalize data from scratch #python

How do you normalize data from scratch using Python 3.14? How do i perform feature scaling from scratch using only numpy?

0:06
How do you normalize data from scratch #python

1,088 views

3 weeks ago

Analytics Benchmark
Data Analytics – Free Demo | Analytics Benchmark | 8374015055

Data Analytics – Free Demo | Analytics Benchmark Ready to build a career in Data Analytics? Join our Free Data Analytics ...

0:25
Data Analytics – Free Demo | Analytics Benchmark | 8374015055

19 views

2 weeks ago

BioniChaos
Can AI Agents Win a Kaggle competition? Debugging LightGBM & Feature Selection

In this coding session, we explore the capabilities of AI agents in a real-world data science context, specifically focusing on a ...

59:16
Can AI Agents Win a Kaggle competition? Debugging LightGBM & Feature Selection

13 views

12 days ago

Analytics Benchmark
Data Analytics – Free Demo | Analytics Benchmark | 8374015055

Data Analytics – Free Demo | Analytics Benchmark Ready to build a career in Data Analytics? Join our Free Data Analytics ...

0:45
Data Analytics – Free Demo | Analytics Benchmark | 8374015055

25 views

3 weeks ago

The Debug Zone
How to Create Continuous Color Maps with Pyplot Contourf in Matplotlib

... #pythonplotting, #matplotlibtutorial, #contourplots, #colormapping, #dataanalysis, #scientificvisualization, #pythonprogramming, ...

1:30
How to Create Continuous Color Maps with Pyplot Contourf in Matplotlib

0 views

2 weeks ago

The Debug Zone
How to Concatenate Pandas DataFrames with Different Columns in Python

In this video, we'll explore the powerful capabilities of the Pandas library in Python, specifically focusing on how to concatenate ...

1:52
How to Concatenate Pandas DataFrames with Different Columns in Python

0 views

3 weeks ago

The Debug Zone
How to Read CSV from SharePoint Using Pandas in Python: Authentication Guide

In this video, we'll explore how to efficiently read CSV files stored in SharePoint using the powerful Pandas library in Python.

3:02
How to Read CSV from SharePoint Using Pandas in Python: Authentication Guide

0 views

11 days ago