Upload date
All time
Last hour
Today
This week
This month
This year
Type
All
Video
Channel
Playlist
Movie
Duration
Short (< 4 minutes)
Medium (4-20 minutes)
Long (> 20 minutes)
Sort by
Relevance
Rating
View count
Features
HD
Subtitles/CC
Creative Commons
3D
Live
4K
360°
VR180
HDR
119 results
We show you how we can help you model marketing data such as inferring uncapped demand from limited sales. Comments ...
52 views
6 days ago
Sign up to Playfair+ http://bit.ly/4lgOeio - Discount code: TableauTim - Good for 10% discount at checkout. [ Affiliate Link ] My ...
758 views
Additionally, I attempt to generate a PowerPoint presentation based on the data analysis done by Claude. Key topics covered ...
447 views
2 days ago
In this video, I map out the titles of the top 1200 videos on AI using https://infranodus.com and use the data visualization to reveal ...
904 views
1 day ago
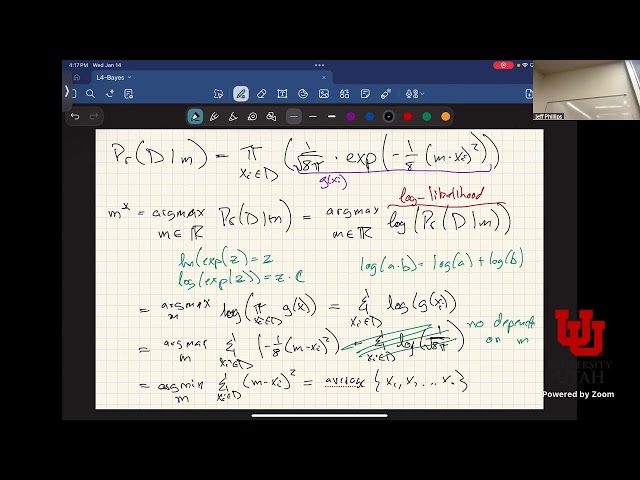
Bayes Rule. Cracked Windshield Example. Pr(Model given Data). Example with n data points in 1 dimension assuming normal ...
84 views
Streamed 7 days ago
Spreadsheets are often dismissed as legacy tools, yet they remain the most widely used interface for analysis, modeling, and ...
9,980 views
Get the Prompts + Templates: https://www.skool.com/the-ai-edge/about Ready to transform your business with AI? Let's talk: ...
91 views
In this video, we are taking a tour of the freshly redeployed BioniChaos platform, showcasing a suite of wild AI tools and interactive ...
0 views
5 days ago
... manual workload, gain deeper insights through automated data analysis, and focus their energy on high-level growth strategy.
6,003 views
Join My Skool Community (FULL Templates & more) - https://www.skool.com/ai-automations-for-sales Sign up to NotebookLM ...
2,338 views
3 days ago
Join us for a live coding and debugging session where we put the world's top AI models to the test. In this video, we are working ...
My Microsoft Excel Playlist: https://www.youtube.com/playlist?list=PLHrw3fxxgFBRyH308kfvRZnAIevkaKkf0 Are your percentage ...
7,150 views
My Microsoft Excel Playlist: https://www.youtube.com/playlist?list=PLHrw3fxxgFBRyH308kfvRZnAIevkaKkf0 Are you using the ...
1,148 views
15 hours ago
How we use Stan to estimate price elasticity from mixed populations.
27 views
Pat critiques a figure from a paper published in the scientific journal Nature Microbiology that created a unique heatmap that ...
334 views
B.COM (PROG / HONS) | COMPLETE COURSE LIST | DISCOUNT AVAILABLE Shiksha Dham – DU Latest Syllabus | Live ...
220 views
AI agents are changing the way we approach data analysis, feature engineering, and dataset understanding. When used correctly ...
1,111 views
Gabby Palomo leads a discussion of Chapter 2 ("Programming languages: dumbbell charts with ggplot2") from The Art of Data ...
44 views
DBSCAN Clustering | Machine Learning Tutorial for Beginners| Day 24 #machinelearning #DBSCAN Clustering #AI ...
8 views
My Microsoft Excel Playlist: https://www.youtube.com/playlist?list=PLHrw3fxxgFBRyH308kfvRZnAIevkaKkf0 Are your Excel charts ...
5,317 views
![AI can't do data analysis? Claude Cowork thinks different. [Un-edited]](/api/proxy/image?url=https%3A%2F%2Fi.ytimg.com%2Fvi%2FOTxSj9VKRG4%2Fsddefault.jpg)