Upload date
All time
Last hour
Today
This week
This month
This year
Type
All
Video
Channel
Playlist
Movie
Duration
Short (< 4 minutes)
Medium (4-20 minutes)
Long (> 20 minutes)
Sort by
Relevance
Rating
View count
Features
HD
Subtitles/CC
Creative Commons
3D
Live
4K
360°
VR180
HDR
38 results
41 views
8 years ago
306 views
This lesson expands on the optogenetic spike train data we worked with in the previous chapter. Now we have data recorded from ...
527 views
4 years ago
Learn how to read and display images in MATLAB.
218 views
5 years ago
Learn how to perform arithmetic operations in MATLAB.
105 views
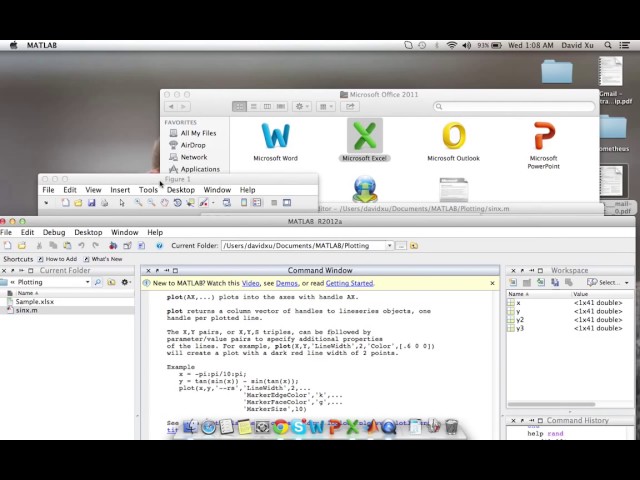
Sometimes we need to show more than one data set on a figure. This video shows a couple techniques for doing that, within the ...
628 views
Saving plots basic savefig png, pdf, ps, eps, svg going to OS and looking at the file.
1,123 views
11 years ago
We've made a plot... now how do we make it look good? Introduction to basic plot formatting features like linestyle, markertype, ...
633 views
Symbolic variables in MATLAB mean the same thing as symbolic variables in a math textbook: they represent all possible "x" ...
2,379 views
574 views
862 views
BIDS Data Science Lecture Series | September 4, 2015 | 1:00-2:30 p.m. | 190 Doe Library, UC Berkeley Speaker: Nathaniel Smith, ...
1,941 views
Streamed 10 years ago
Learn how plots in R can be combined or overlaid to give increased information density and insight in data visualizations.
2,711 views
9 years ago
275 views
Virginia Tech ME 2004: MATLAB Basics (01a) 01a and 01b provide an introduction to ME 2004 Workshops and MATLAB Grader.
3,094 views
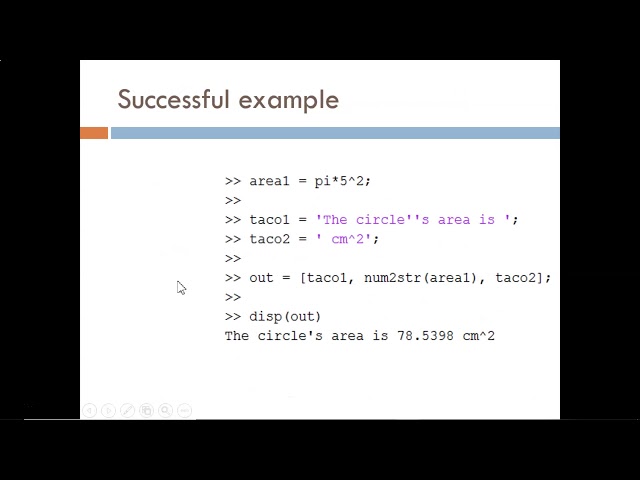
Functions useful for displaying results: disp, num2str, fprintf. Combining numeric variables with character arrays to write useful ...
2,656 views
Plotting the data plot L vs. T2 using square function problem with 3 cols 3rd column is error error bar.
108 views
For set the Font and Size of Title, X/Ylabel, and Numbers of Bode Diagram or Step Response; in Command Window of MATLAB ...
1,772 views
Multiple plots overlays linspace give one with very few points, more points show smoothness of the curve legend figure 1, figure2 ...
651 views
572 views