Upload date
All time
Last hour
Today
This week
This month
This year
Type
All
Video
Channel
Playlist
Movie
Duration
Short (< 4 minutes)
Medium (4-20 minutes)
Long (> 20 minutes)
Sort by
Relevance
Rating
View count
Features
HD
Subtitles/CC
Creative Commons
3D
Live
4K
360°
VR180
HDR
117 results
Aalto University course CS-E4510 Distributed Algorithms. Lecture 11, part a: Hardness of coloring https://jukkasuomela.fi/da2020/
761 views
5 years ago
Aalto University course CS-E4510 Distributed Algorithms. Lecture 4, part a: Fast graph coloring. https://jukkasuomela.fi/da2020/
2,582 views
Aalto University course CS-E4510 Distributed Algorithms. Lecture 6, part a: Randomized coloring. https://jukkasuomela.fi/da2020/
1,364 views
Aalto University course CS-E4510 Distributed Algorithms. Lecture 1, part b: Coloring cycles fast. https://jukkasuomela.fi/da2020/
3,402 views
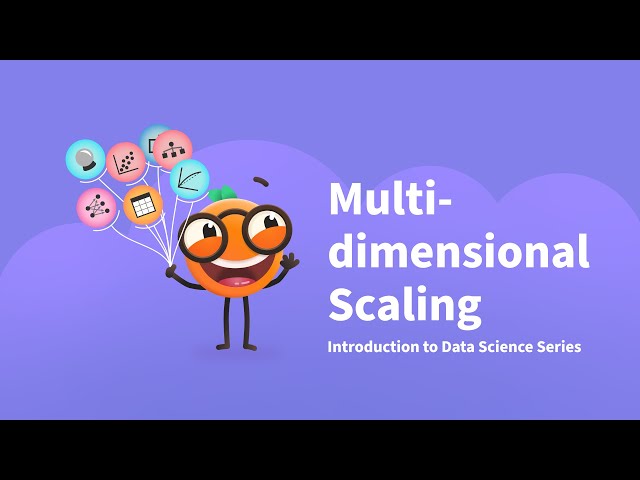
In this video we introduce Multidimensional scaling (MDS), an alternative tool for presenting data and reducing dimensionality.
20,322 views
2 years ago
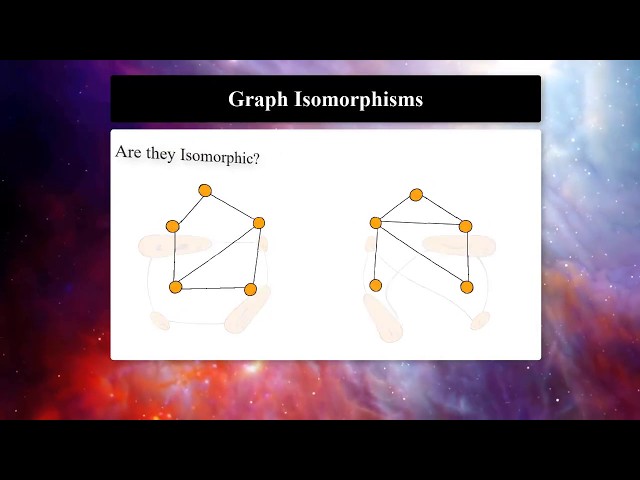
Unit 2 Module 3: Isomorphic Graphs Algorithmic Information Dynamics: A Computational Approach to Causality and Living ...
2,137 views
7 years ago
A brief introduction to the Arena3D web tool for 3D visualization of multilayer networks. I first explain how multilayer networks can ...
1,409 views
3 years ago
QAM (Quadrature Amplitude Modulation) is a technique that encodes information into both the amplitude and phase of a signal.
113,078 views
9 months ago
A bioinformatics tutorial on network visualization of omics data using Cytoscape and several Cytoscape apps. I first show how to ...
11,480 views
4 years ago
Aalto University course CS-E4510 Distributed Algorithms. Lecture 7, part a: Covering maps. https://jukkasuomela.fi/da2020/
924 views
Aalto University course CS-E4510 Distributed Algorithms. Lecture 2, part a: Graph-theoretic foundations.
2,609 views
This is an audio version of the Wikipedia Article: https://en.wikipedia.org/wiki/Discharging_method_(discrete_mathematics) ...
149 views
6 years ago
Grouping by color on a single graph is one way to group things it can be really useful if we have a small number of groups that ...
563 views
In this detailed walkthrough, I dive into the complexities of developing an interactive knowledge graph using Python, NetworkX, ...
435 views
We've made a plot... now how do we make it look good? Introduction to basic plot formatting features like linestyle, markertype, ...
633 views
A brief introduction to how Arena3D and Cytoscape can be combined. I first introduce the Arena3D is a web tool for 3D ...
1,179 views
Ever wondered how navigation apps like Google Maps actually work? In this video, I break down the entire routing process in a ...
90,401 views
1 month ago
we propose a method to reconstruct spatio-temporal fluid functions with implicit continuous neural representations from RGB ...
1,203 views
We can use "phase plots" to visualize functions f : ℂ → ℂ. Thanks to @rreusser for the phase plotting code at ...
2,457 views
A look at the dark side of the metrics commonly used for analysis of biological networks. The presentation first recaps the issues ...
1,191 views