Upload date
All time
Last hour
Today
This week
This month
This year
Type
All
Video
Channel
Playlist
Movie
Duration
Short (< 4 minutes)
Medium (4-20 minutes)
Long (> 20 minutes)
Sort by
Relevance
Rating
View count
Features
HD
Subtitles/CC
Creative Commons
3D
Live
4K
360°
VR180
HDR
230 results
This video explains about the basic steps to draw polar plot of type zero system. The polar plot is a topic of control system ...
12,151 views
9 years ago
In this Inside Wireless episode we speak about radiation diagram basics. The radiation diagram describes how strongly an ...
81,858 views
6 years ago
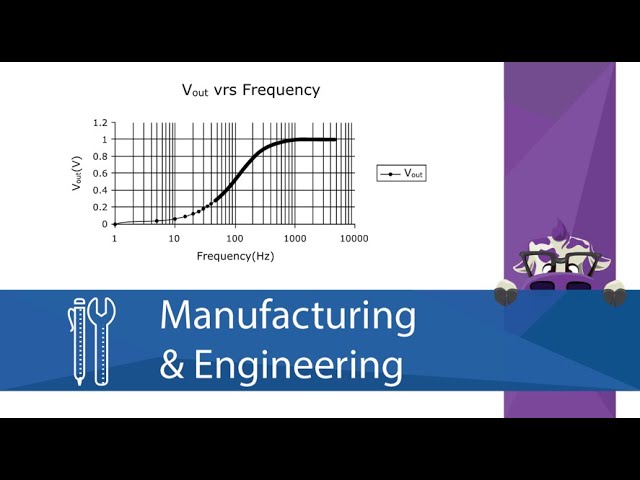
The circuit is also simulated in Electronic WorkBench and the resulting Bode plot is compared to the graph from Excel. Thanks for ...
2,313 views
4 years ago
I use iPhone 17 pro max→ https://amzn.to/3Vr1BB6 In this video of #engineeringmanagementacademy ...
2,855 views
1 year ago
Advantages and problems of higher-order filters are explained by the Bode diagram and the phasor diagram. In addition we ...
8,329 views
4,490 views
5 years ago
For set the Font and Size of Title, X/Ylabel, and Numbers of Bode Diagram or Step Response; in Command Window of MATLAB ...
1,777 views
The output of the FFT is just a list of complex numbers. But, we are used to seeing the FFT of a signal represented as a graph of ...
28,607 views
3 years ago
A step by step guide for calculating Vmax and Km from a Lineweaver-Burk plot in Excel.
107,741 views
We can use "phase plots" to visualize functions f : ℂ → ℂ. Thanks to @rreusser for the phase plotting code at ...
2,512 views
EMC problems usually occur at higher frequencies than the highest internal frequency. The reason for this is that any arbitrary ...
8,088 views
I use Insta360: https://amzn.to/4mvNoxZ In this video of #engineeringmanagementacademy #Paretofront is tutored for ...
2,784 views
Power Electronics and Distributed Generation by Dr. Vinod John,Department of Electrical Engineering,IISc Bangalore.For more ...
22,805 views
11 years ago
Typo at 7:45, should have been Y(s)/U(s)
659 views
7 years ago
This Tutorial describes two basic implementations of analog to digital converters, the flash converter and the successive ...
9,275 views
In this tutorial, we implement a moderation analysis in Stata. We use interaction terms and interpret and visualize the marginal ...
4,005 views
Learners follow the steps required to perform the Ziegler-Nichols reaction curve process identification procedure. Thanks for ...
4,146 views