ViewTube

ViewTube
Sign inSign upSubscriptions
Filters

Upload date

Type

Duration

Sort by

Features

Reset

93 results

NPTEL IIT Bombay
Tutorial 04 Part 01: Plotting In 1 D Using Python

Week 4: Tutorial 04 Part 01: Plotting In 1 D Using Python.

28:22
Tutorial 04 Part 01: Plotting In 1 D Using Python

1,180 views

3 years ago

COMPUTER & EXCEL SOLUTION
function in python in hindi with full explanation@COMPUTEREXCELSOLUTION #python #function

Join this channel to get access to perks: https://www.youtube.com/channel/UC4C_tfy6WLDxzVVO3y6YinA/join This is my ...

9:14
function in python in hindi with full explanation@COMPUTEREXCELSOLUTION #python #function

27 views

1 year ago

COMPUTER & EXCEL SOLUTION
Create a function to find prime number in python in hindi@COMPUTEREXCELSOLUTION

Join this channel to get access to perks: https://www.youtube.com/channel/UC4C_tfy6WLDxzVVO3y6YinA/join This is my ...

0:51
Create a function to find prime number in python in hindi@COMPUTEREXCELSOLUTION

67 views

2 years ago

freeCodeCamp.org
Python for Everybody - Full University Python Course

This Python 3 tutorial course aims to teach everyone the basics of programming computers using Python. The course has no ...

13:40:10
Python for Everybody - Full University Python Course

7,578,005 views

6 years ago

Tyler Caraza-Harter
CS 320 Nov 2 (Part 1) - Shapely Venn Diagram

... towards my ultimate goal of making the venn diagram i need to somehow get these on a matplotlib area and so you can see i've ...

24:31
CS 320 Nov 2 (Part 1) - Shapely Venn Diagram

451 views

5 years ago

DataScienceIB
Python Programming Tutorial for SAS Data Analysis 3/3

This video is the last of three parts of a programming tutorial on using Python for data analysis of small-angle scattering ...

43:00
Python Programming Tutorial for SAS Data Analysis 3/3

74 views

3 years ago

New Mexico EPSCoR
Python Fundamentals with Data Analysis and Visualization

Python is a high-level programming language that is leveraged in a wide range of disciplines and fields. This webinar training ...

47:21
Python Fundamentals with Data Analysis and Visualization

140 views

4 years ago

Tyler Caraza-Harter
CS 320 Nov 9 (Part 1) - Vector Multiplication

... math classes we'll talk about it as one-dimensional and then we'll say which angle it goes um in python and numpy in particular ...

22:33
CS 320 Nov 9 (Part 1) - Vector Multiplication

235 views

5 years ago

COMPUTER & EXCEL SOLUTION
Text to columns in Google sheet@COMPUTEREXCELSOLUTION

This is my Technology Related information.Like "O" Level,"CCC", "Webdesign", "C" language, "C++" "Php","Java","Java Script", ...

0:59
Text to columns in Google sheet@COMPUTEREXCELSOLUTION

215 views

4 years ago

NPTEL IIT Bombay
Lecture 15:  Regression

Lecture 15: Regression.

32:31
Lecture 15: Regression

8,240 views

6 years ago

COMPUTER & EXCEL SOLUTION
Comma Separated value in python@COMPUTEREXCELSOLUTION

Join this channel to get access to perks: https://www.youtube.com/channel/UC4C_tfy6WLDxzVVO3y6YinA/join This is my ...

3:45
Comma Separated value in python@COMPUTEREXCELSOLUTION

103 views

3 years ago

COMPUTER & EXCEL SOLUTION
Creating voice with GTTS package in python@COMPUTEREXCELSOLUTION

Join this channel to get access to perks: https://www.youtube.com/channel/UC4C_tfy6WLDxzVVO3y6YinA/join This is my ...

2:20
Creating voice with GTTS package in python@COMPUTEREXCELSOLUTION

148 views

3 years ago

Pathling
How to group SNOMED data using Python and a terminology server

Have you ever wondered how to group or categorise your SNOMED codes? You can use the Pathling Python library to call out to ...

9:39
How to group SNOMED data using Python and a terminology server

618 views

2 years ago

MOOC de l'IMT
8. Queuing Structures for Graph Traversals 🌐 Advanced Algorithmics and Graph Theory with Python

Strengthen your skills in algorithmics and graph theory, and gain experience in programming in Python along the way. To follow ...

11:09
8. Queuing Structures for Graph Traversals 🌐 Advanced Algorithmics and Graph Theory with Python

3,284 views

7 years ago

BocoupLLC
Vega Lite: A Grammar of Interactive Graphics - Wongsuphasawat, Moritz, and Satyanarayan

To perform interactive analysis in Python, you can use a library led by Brian Granger. And we can create this histogram that we ...

30:07
Vega Lite: A Grammar of Interactive Graphics - Wongsuphasawat, Moritz, and Satyanarayan

34,526 views

8 years ago

datalabcc
Coding - Data Science: An Introduction - 3.2

Coding, or computer programming, is an important element of data science but is far from a synonymous term.

3:02
Coding - Data Science: An Introduction - 3.2

1,475 views

8 years ago

NPTEL IIT Bombay
Tutorial 01: Python Programming From Beginner Perspective

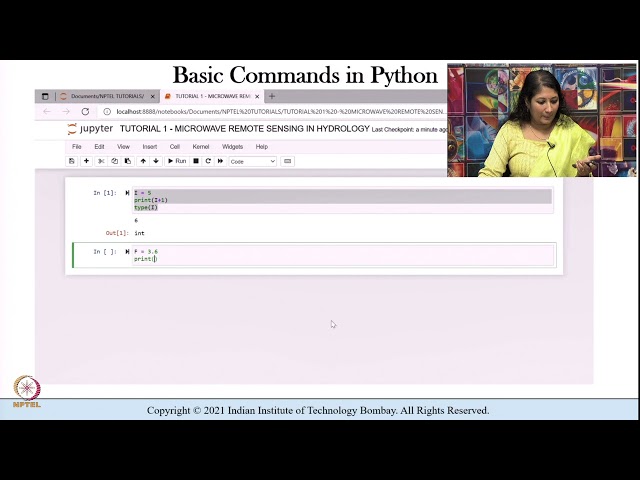
Week 1: Tutorial 01: Python Programming From Beginner Perspective.

38:54
Tutorial 01: Python Programming From Beginner Perspective

3,027 views

4 years ago

Learn by Dibya
What is Python Data Type #viralvideo #viralshorts #pythonprogramming#pythonfeatures #pythondatatypes

... 12 python python for data science flask tutorial numpy python full course in telugu py matplotlib python pyspark tutorial python ...

0:38
What is Python Data Type #viralvideo #viralshorts #pythonprogramming#pythonfeatures #pythondatatypes

137 views

2 years ago

COMPUTER & EXCEL SOLUTION
Creating chart in Libre calc@COMPUTEREXCELSOLUTION

This is my Technology Related information.Like "O" Level,"CCC", "Webdesign", "C" language, "C++" "Php","Java","Java Script", ...

2:51
Creating chart in Libre calc@COMPUTEREXCELSOLUTION

135 views

4 years ago

Tyler Caraza-Harter
CS 320 Oct 28 (Part 2) - Plot Annotations

... i say um import matplotlib.pi plot as plt and i can say plt.rc params font size equals 16. that's good and then for the spines the the ...

25:30
CS 320 Oct 28 (Part 2) - Plot Annotations

222 views

5 years ago