Upload date
All time
Last hour
Today
This week
This month
This year
Type
All
Video
Channel
Playlist
Movie
Duration
Short (< 4 minutes)
Medium (4-20 minutes)
Long (> 20 minutes)
Sort by
Relevance
Rating
View count
Features
HD
Subtitles/CC
Creative Commons
3D
Live
4K
360°
VR180
HDR
44 results
Learn Data Visualization in Python and transform raw data into meaningful insights using powerful charts and graphs! Data ...
0 views
4 days ago
Matplotlib is Python's most powerful data visualization library — and most tutorials only scratch the surface. This crash course ...
37 views
3 weeks ago
Ahmed_Sami #Arabic_Big_Data Exploratory Data Analysis using Python To support via PayPal ...
13,309 views
6 days ago
Python Tutorial for Beginners | Understanding Data Types in Python Welcome to Lecture 2 of our Python Programming Course!
30 views
4 weeks ago
Same data. Two plots. One reveals the chemistry; the other hides it — and nobody faked a number. A figure is an analytical ...
59 views
2 weeks ago
... इन Python के अंदर यहां पर हमारा प्रोग्राम है और यहां हमारा इसका आउटपुट ...
12 views
import matplotlib.pyplot as plt → Imports Matplotlib plotting module. plt.plot(x, y) → Draws a line graph. plt.title() → Adds a graph ...
18 views
Here is a punchy, professional description you can drop into your YouTube video's "About" section or the video description box: ...
21 views
Jupyter Notebook: Everything You Need to Know | Python | AI | ML | DL | Data Science** Welcome to this hands-on tutorial on ...
70 views
This short webinar gives a basic introduction on the HIDE-deconv command line tool for cellular deconvolution of bulk ...
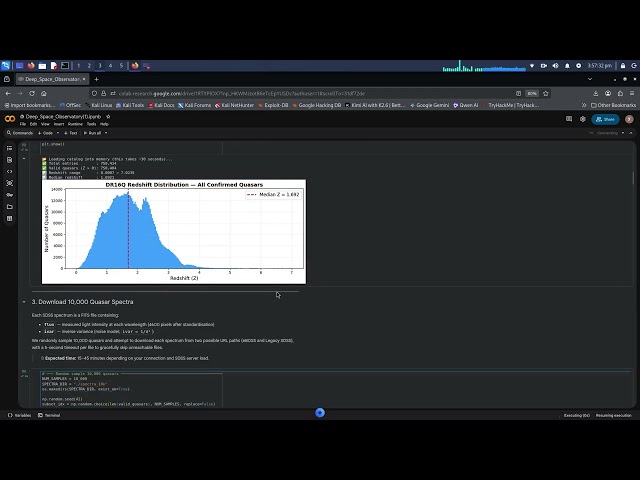
You rarely collect just one spectrum. Most experiments generate hundreds—or thousands—of spectra that all need the same ...
51 views
1 day ago
Speaker Mthetho Sovara Track Data Science and Engineering Type Short Talk (25 minutes) Abstract Climate change is a lived ...
6 views
11 days ago
Course Description Welcome to the course **Python Programming: Fundamentals to Advanced Applications | AI | ML | DL. Python ...
131 views
... python algorithm tutorial, python coding interview, python interview prep, python recursion, recursion tutorial, python data ...
2 views
22 hours ago
Installation and Setup of Anaconda for Jupyter Notebook |Python | AI | ML | Data Science | Installation and Setup of Anaconda ...
92 views
Project Showcase: Automated Credit Card Fraud Detection & Transaction Intelligence System Excited to share my latest Machine ...
1 view
Data Science using Artificial Intelligence (AI) Notes: ...
11 views
Learn Pandas in Python from scratch and start working with real-world data like a Data Analyst or Data Scientist! Pandas is one of ...
Make Dynamic & Combo Charts in MS Excel How to Make Charts in MS Excel? Learn how to make Dynamic chart in MS Excel ...
8 views
9 days ago
... IBM Data Analysis Specialization - https://coursera.pxf.io/AoYOdR Tableau Data Visualization - https://coursera.pxf.io/MXYqaN ...
2,823 views